Raising Canes$ (Where $ = CASH)
We don’t put out interim updates unless there’s really something significant going on. There is. Risk in both credit and stock markets has increased to its highest level since last April.
We’re not known for brevity, but this will be. Promise.
A Change In Character
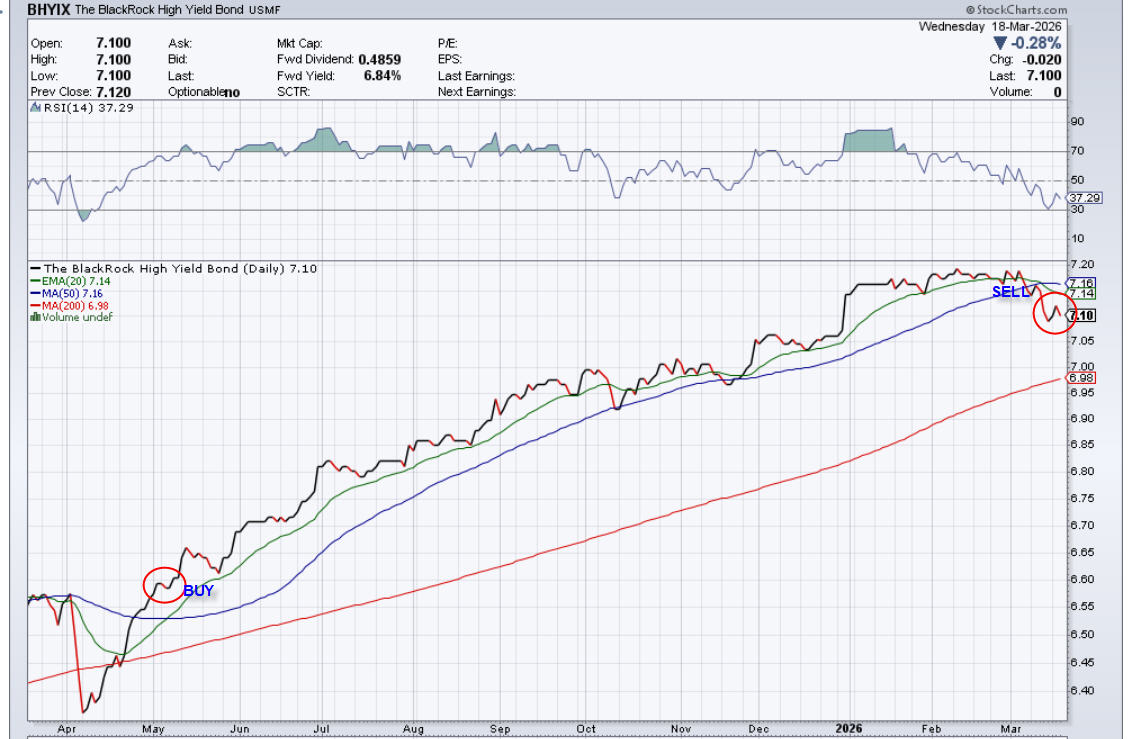
This past Monday, March 16, three of our models triggered SELL signals, including two of our intermediate term stock market models, and our high yield bond model, which had been on a BUY signal since May of 2025. As a result, our tactical equity exposure is down to 40%, the lowest since April and May of last year, and all funds in our tactical high yield model have been shifted to ultra-short bond funds. Take a look at the chart below of the Blackrock High Yield Fund (BHYIX), as one example of how high yield bonds have been acting.
In addition, below is a chart of the S&P 500 Index. Both charts are courtesy of www.stockcharts.com.
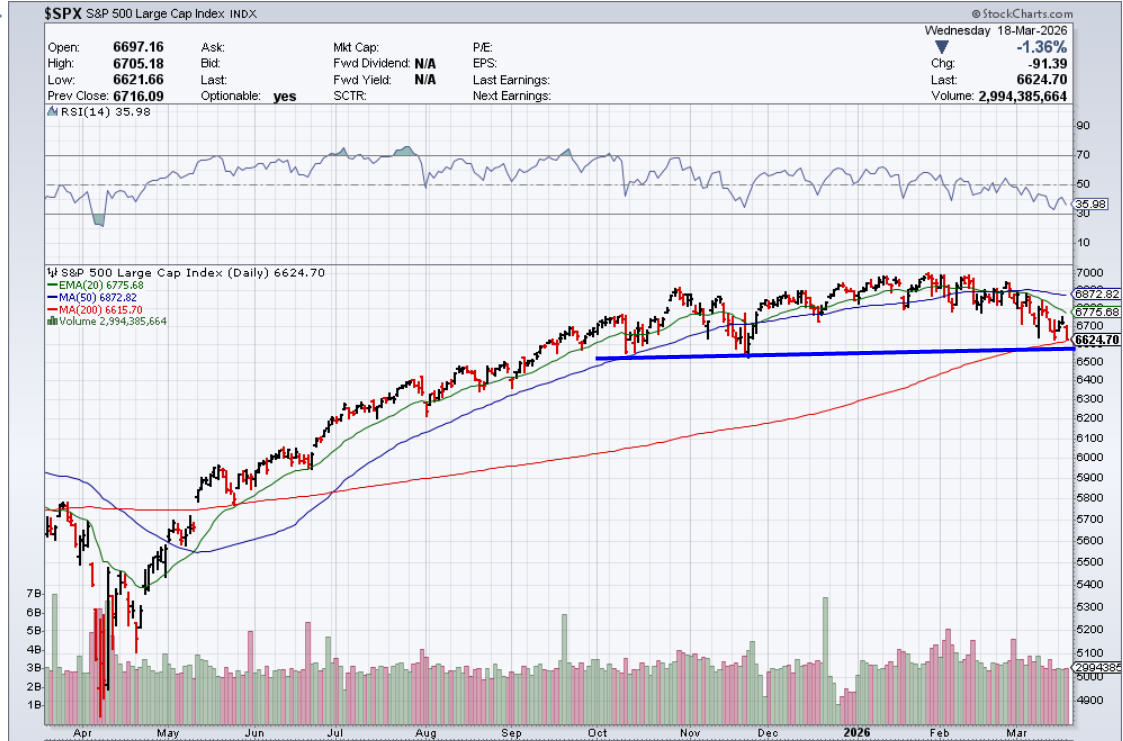
The S&P 500 is sitting on chart support around the 6600 level, which is about to be tested. A break below it would suggest a possible move to the 5900 level, the next level down. We can’t quantify this, but the chart is showing a rounding top, and given the deteriorating evidence, we’d not be surprised by a complete breakdown.
What does this mean? From an exposure standpoint, our credit exposure has decreased significantly. And in terms of equity exposure, in a typical Moderate Risk account where our maximum equity allocation is currently 55%, we are at under 30% as of this past Monday’s close.
It’s important to make a point of this. Every SELL signal from our models does not result in lower prices, whether it be high yield bonds, or stocks. Often, things turn around, and we end up buying back higher. BUT. We can also say this. Because of the nature of our models, virtually every significant decline in high yield bonds and stocks takes place AFTER our models have turned negative. And that’s where we stand. We still have two stock models that have yet to turn negative, but the bottom line is this. We can’t know the future, but at this juncture, risk management is very important, and we’re just following our process. This is how it works. No predictions. No promises. But don’t be surprised by further weakness in financial markets. The evidence is very high risk.
Best wishes,

Bob Kargenian, CMT
President
TABR Capital Management
TABR Capital Management, LLC (“TABR”) is an SEC registered investment advisor with its principal place of business in the state of California. TABR and its representatives are in compliance with the current notice filing and registration requirements imposed upon registered investment advisors by those states in which TABR maintains clients. TABR may only transact business in those states in which it is notice filed, or qualifies for an exemption or exclusion from notice filing requirements.
This newsletter is limited to the dissemination of general information pertaining to our investment advisory/management services. Any subsequent, direct communication by TABR with a prospective client shall be conducted by a representative that is either registered or qualifies for an exemption or exclusion from registration in the state where the prospective client resides. For information pertaining to the registration status of TABR, please contact TABR or refer to the Investment Advisor Disclosure web site (www.adviserinfo.sec.gov).
The TABR Model Portfolios are allocated in a range of investments according to TABR’s proprietary investment strategies. TABR’s proprietary investment strategies are allocated amongst individual stocks, bonds, mutual funds, ETFs and other instruments with a view towards income and/or capital appreciation depending on the specific allocation employed by each Model Portfolio. TABR tracks the performance of each Model Portfolio in an actual account that is charged TABR’s investment management fees in the exact manner as would an actual client account. Therefore the performance shown is net of TABR’s investment management fees, and also reflects the deduction of transaction and custodial charges, if any.
Comparison of the TABR Model Portfolios to the Vanguard Total Stock Index Fund, the Vanguard Total International Stock Fund, the Vanguard Total Bond Index Fund and the S&P 500 Index is for illustrative purposes only and the volatility of the indices used for comparison may be materially different from the volatility of the TABR Model Portfolios due to varying degrees of diversification and/or other factors.
Past performance of the TABR Model Portfolios may not be indicative of future results and the performance of a specific individual client account may vary substantially from the composite results above in part because client accounts may be allocated among several portfolios. Different types of investments involve varying degrees of risk, and there can be no assurance that any specific investment will be profitable.
For additional information about TABR, including fees and services, send for our disclosure statement as set forth on Form ADV from us using the contact information herein. Please read the disclosure statement carefully before you invest or send money.
A list of all recommendations made by TABR within the immediately preceding one year is available upon request at no charge. The sample client experiences described herein are included for illustrative purposes and there can be no assurance that TABR will be able to achieve similar results in comparable situations. No portion of this writing is to be interpreted as a testimonial or endorsement of TABR’s investment advisory services and it is not known whether the clients referenced approve of TABR or its services.