Roth 401Ks, New Highs, High Yield Bonds, And The Power Of Food
A growing number of workplace retirement plans are beginning to offer Roth 401 (k) plans in addition to the regular 401 (k) plan. Often, we get asked the question—which one is better? Even with the math we did, it turns out that question isn’t so easy to answer. But we definitely provide our thoughts.
Meanwhile, stock indexes are approaching their recent highs once again, but participation is lagging. That’s a warning sign we’ll discuss. Speaking of high, high yield bond funds are making new highs. The beat has been going on since mid-January, and it’s a great example of trend following.
Finally, we have a piece on our friend, Bill Bracken, and the wonderful things he and his staff are doing at Bracken’s Kitchen, through the power of food. Read on.
Roth 401 (k) Plans—Should You, Or Shouldn’t You?
Recent studies show that nearly 70% of workplace retirement plans now offer a 401 (k) Roth option. How is this different from a regular 401 (k)? The primary differences between the two plans are how contributions go in, and how withdrawals come out. Simply put, Roth contributions are made after tax, while traditional 401 (k) contributions are made before tax, and therefore serve to reduce your taxable income. Contribution limits are the same.
For example, let’s presume an individual earns a gross salary of $119,000. If they were to contribute the full maximum of $19,000(assuming they were under the age of 50), their pre-tax income would be reduced to $100,000. So, you’ll get tax relief now, and pay taxes later, as withdrawals from traditional 401 (k) plans are taxed as ordinary income. In contrast, if you put the full $19,000 into a Roth 401 (k), in the example I’m using, they would need to earn about $27,000 to do, paying about 30% in taxes upfront (22% for federal and 8% for state, in this case assuming a California resident). However, when it comes time to withdraw the money during retirement, there is no tax on Roth withdrawals. The one exception would be the matching contributions from one’s employer, which are taxed.
What’s the better choice? The biggest driver in answering this question accurately is current vs future tax rates, with a secondary driver being the impact of required minimum distributions. Ultimately, greater wealth is created by paying taxes when the rates are lowest. Unfortunately, none of know the future. Basically, if rates are low today and higher in the future, the Roth is the better choice whereas if the tax rates are lower in retirement for a person, then the traditional 401 (k) is better. That’s impossible to know, though, isn’t it?
As a result, I’ve attempted to model a worksheet starting with a 25-year-old worker, using as close to an apples-to-apples comparison as I could come up with. Below, I will show 3 segments of the worksheet. The complete analysis is too long, but feel free to email me for it should you have an interest. Here are my assumptions. The worker saves 10% of their pre-tax income, starting at age 25 with an $80,000 salary, escalating to $100,000 at age 35, to $120,000 at age 45, and to $140,000 at age 55, then retiring at age 65. For the Roth contributions, they were assumed to be 70% of the regular 401 (k), to account for 22% in federal taxes and 8% in state tax. See below.
| ROTH 401K | Regular 401K | |||||||
| Age | New Balance | Deposit | Growth at 6% | Balance | New Balance | Deposit | Growth at 6% | Balance |
| 25 | 5600 | 336 | 5936 | 8000 | 480 | 8480 | ||
| 26 | 5936 | 5600 | 692 | 12228 | 8480 | 8000 | 989 | 17469 |
| 27 | 12228 | 5600 | 1070 | 18898 | 17469 | 8000 | 1528 | 26997 |
| 28 | 18898 | 5600 | 1470 | 25968 | 26997 | 8000 | 2100 | 37097 |
| 29 | 25968 | 5600 | 1894 | 33462 | 37097 | 8000 | 2706 | 47803 |
| 30 | 33462 | 5600 | 2344 | 41405 | 47803 | 8000 | 3348 | 59151 |
| 31 | 41405 | 5600 | 2820 | 49826 | 59151 | 8000 | 4029 | 71180 |
| 32 | 49826 | 5600 | 3326 | 58751 | 71180 | 8000 | 4751 | 83931 |
| 33 | 58751 | 5600 | 3861 | 68212 | 83931 | 8000 | 5516 | 97446 |
| 34 | 68212 | 5600 | 4429 | 78241 | 97446 | 8000 | 6327 | 111733 |
| 35 | 78241 | 5600 | 5030 | 88872 | 111733 | 8000 | 7186 | 126960 |
| 36 | 88872 | 7000 | 5752 | 101624 | 126960 | 10000 | 8218 | 145177 |
As one can see, by age 36, there is a difference of about $44,000 in favor of the traditional 401k. Below, we pick up the worksheet at age 61, assuming the person retires at age 65, and then begins withdrawals at age 66, starting with a 4% net draw. You’ll see that in order to equate to this same rough amount in dollars, the draw rate from the regular 401 (k) will need to begin at 5.7%.
| Roth 401 (k) | Regular 401(k) | |||||||
| Age | New Balance | Deposit/Draw | Growth at 6% | Balance | New Balance | Deposit/Draw | Growth at 6% | Balance |
| 61 | 831427 | 9800 | 50474 | 891701 | 1187753 | 14000 | 72105 | 1273859 |
| 62 | 891701 | 9800 | 54090 | 955591 | 1273859 | 14000 | 77272 | 1365130 |
| 63 | 955591 | 9800 | 57923 | 1023315 | 1365130 | 14000 | 82748 | 1461878 |
| 64 | 1023315 | 9800 | 61987 | 1095101 | 1461878 | 14000 | 88553 | 1564431 |
| 65 | 1095101 | 9800 | 66294 | 1171196 | 1564431 | 14000 | 94706 | 1673136 |
| 66 | 1171196 | -46848 | 67461 | 1191809 | 1673136 | -95369 | 94666 | 1672434 |
| 67 | 1191809 | -47672 | 68648 | 1212784 | 1672434 | -95329 | 94626 | 1671731 |
We kept the withdrawal rate at 4% until age 74, since at that age, assuming one had done an IRA rollover at retirement, they would be subject to the minimum distribution rules that kick in beginning at age 70 1/2. As we illustrated in an article earlier this year (The Conundrum of Drawing Down Your Retirement Funds), this rate increases each year. It is 4.2% at age 74, is 5.12% at age 79, and jumps to 6.13% by age 83. We’ve incorporated this into our worksheet, and below, we show what happens between the ages of 80 to 83. In accounting for taxes, the draw rate for the regular 401 (k) at age 83 would be 8.76%.
| Roth 401(k) | Regular 401(k) | |||||||
| Age | New Balance | Draw | Growth at 6% | Balance | New Balance | Draw | Growth at 6% | Balance |
| 80 | 1436214 | -76694 | 81571 | 1441091 | 1566851 | -119707 | 86829 | 1533972 |
| 81 | 1441091 | -80413 | 81641 | 1442319 | 1533972 | -122258 | 84703 | 1496417 |
| 82 | 1442319 | -84231 | 81485 | 1439573 | 1496417 | -124951 | 82288 | 1453755 |
| 83 | 1439573 | -88246 | 81080 | 1432407 | 1453755 | -127349 | 79584 | 1405990 |
What you’ll notice is that under these assumptions, at age 83, the amount of money left in the Roth begins to overtake the regular 401 (k), and is superior from that point on. I guess you could call this your break-even analysis. In other words, if you live beyond age 83, one is better off with the Roth 401 (k). But, that would be missing a huge point. Forget extrapolating the data even further, for those healthy clients who live until age 90 or higher. Let’s just assume this person died at age 83. Which is more valuable? That’s easy, you say. The Roth 401 (k) has about $26,000 more. It has a lot more than that.
Remember, this money is either passed to a spouse, or one’s children, or another person. There is still tax owed on the entire $1.405 million sitting in the regular 401 (k), which by then has been rolled to an IRA. In contrast, the Roth 401 (k) likewise would have rolled into a Roth IRA, where there are no taxes upon withdrawals. There is one other factor which is also in big favor of the Roth 401 (k). Once that money is rolled over into a Roth IRA, there are no mandatory RMD payouts (required minimum distributions) at age 70 1/2 like there are for traditional IRA accounts.
Are there flaws in this analysis? Of course. First, it illustrates constant growth at 6%. We know that doesn’t happen. It also assumes the same tax rates over a period of nearly 60 years. We also know that is not likely to happen. But, we made all of the variables as constant as we could, and accounted for the differences in taxation. For those of you who reside in lower tax states than California, there would certainly be some differences.
Here’s another variable to consider. We have no way of knowing how long Roth IRA and Roth 401 (k) accounts may be around. With Washington always looking for tax revenue, the attractiveness of these accounts might be eliminated going forward (with existing accounts being grandfathered).
But, given the facts as we see them, it is much more advantageous to have after-tax funds in retirement savings than pre-tax. Especially since those assets can also be passed on free of income taxes. In sum, whether you live to 83 or beyond (or not), the longer you can accumulate money in a Roth 401 (k), the better. All in all, we believe they are the better option for those workers who have access to them.
Lagging Participation Is A Warning, But Lead Times Are Unknown
As the chart below shows, courtesy of www.stockcharts.com, the S&P 500 Index has nearly reached its July 26 intra-day high, but as the middle clip indicates, the number of stocks making new highs within the index are sharply negatively diverging, dropping from over 60 in early September to the current level of 24. You can see from the dashed trendlines from left to right, similar patterns were observed in mid-to-late April and again in July. Both episodes led to declines of about -6%. When you couple this with the negative seasonal pattern which takes us through October and that stocks are at a natural resistance point, the market is appearing vulnerable in the short term.

This drop in overall participation is even more pronounced in the Bullish Percent chart of the NYSE, shown below, courtesy of our friends at www.dorseywright.com. As a reminder, the Bullish Percent is a broad-based breadth indicator, and depicts the percentage of stocks on the New York Stock Exchange that are presently on Point and Figure BUY signals. The chart below goes all the way back to 2011. This indicator peaked at 76% in 2012 and again in 2013. It made a lower high at 70% in 2014 and again in January 2018.

Since then, more recent peaks have taken place at the 58% level in June 2018 and again in April 2019, with current readings at 50%. Interestingly, the NY Composite has failed to exceed its January 26, 2018 high and is currently around 4% below that level, but with the S&P 500 essentially at levels above January 2018, the NY Bullish Percent has fallen from 70% to 50%. This means that fewer and fewer stocks are holding up the major averages. Eventually, they will break down, as they did during last year’s fourth quarter, and this indicator in that sequence fell all the way to the 16% level. We can’t know the timing of that process, but we do know one thing. It will be preceded by this indicator turning down into a column of O’s. That hasn’t happened yet, and there’s no use trying to predict when it will. As we’ll note below, there are some other indicators we track that are still signaling all is OK.
New Highs In High Yield (And The Advance/Decline Line)
A combination of a strong stock market and falling yields has thus far been a good omen for the high yield corporate bond market, with most junk bond funds sporting year-to-date gains ranging from 10.5% to 12% in just 9 months. Below is a chart of one of the funds we own with clients, PIMCO High Yield. After getting whipsawed last fall (see below, chart courtesy of www.stockcharts.com) with a small loss, our high yield fund risk model went on a BUY in mid-January. This signal is now over 8 months old, and prices are at their highest level of the year.
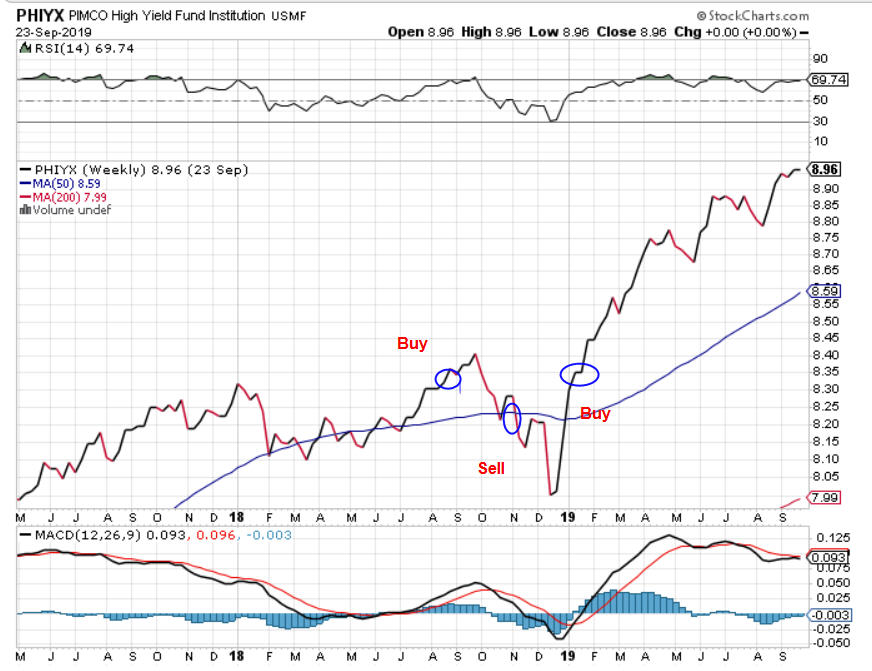
In that prices of junk bonds normally turn down prior to stock market peaks, this should be considered a good sign. But, nothing is perfect. There was no warning last September when prices peaked coincident with stocks, which then fell nearly -20% into late December. With the Fed intent on likely keeping interest rates low, and the yield on the 10-year Treasury Note sitting at 1.65%, owning a high yield bond fund with yields near 6% can be quite attractive (the average yield for the category is 5.91% according to Morningstar).
Using simple charting principles, with the PIMCO fund making higher highs and higher lows, the first sign of trouble would be a close below the 8.80 level, which was the recent reaction low. The MACD indicator (bottom clip) is not confirming the high, and is a sign of weakening momentum, but ultimately, price will tell the story. In addition to high yield bonds acting well, the NY Advance/Decline Line continues to make new all-time highs. Despite the lack of participation I cite above, this is bullish, and history suggests that new highs in stock prices will follow, even if those new highs are narrowly confined to the large cap segment of the stock market.
Portfolio Allocations
We’ve had no changes to exposure either in our stock or bond allocations. Equity allocations have remained at about 85% since June 21, and as noted above, our high yield bond fund risk model has been positive since January 14. At some point, this will change, and we’ll see reductions to allocations as price trends deteriorate, but that’s simply not the case at present.
The Power Of Food And Bracken’s Kitchen
Many of you likely do not know that prior to our daughter Caroline being born in February 2015, my wife Michelle several years earlier had graduated from professional chef’s school in Laguna. She’s pretty amazing in the kitchen, and for a time was teaching knife classes at the school. Unfortunately, she married an old school guy who prefers steak and potatoes, with very little appreciation or taste for “foo-foo” food.
In any case, a few years ago she came across a story about Bill Bracken, a former professional chef who was doing some amazing things, by using his talents by taking food donations and repurposing them into healthy meals for those who need it most. She ended up reaching out to Bill, and soon was volunteering in the kitchen from time to time, even with our daughter Caroline.
Did you know that about 40% of the food produced in our country ends up in the garbage? There are nearly 400,000 who struggle with hunger in Orange County alone, and one in five children are at risk of hunger each month. There are no easy answers for this dilemma, which of course, is not limited to Orange County. But Bill and his team are making a difference, combining their expert culinary skills with their unmatched compassion and love for people.
We’ve become big fans and supporters of Bill and his mission. Last week, Bracken’s Kitchen put on Hunger Games 2.0 at their new facility (one year old) and managed to raise over $120,000 with seven local chefs participating in an evening of great food, drink, music and camaraderie. Below is our family (minus son Adam!) with Bill and his wife Molly.

To get an even better feel, I’d encourage you to view the short video that KCET’s Roy Choi produced for his show, Broken Bread. Just click on this link: https://www.youtube.com/watch?v=sZmHr-VPcTk. Maybe you’ll be as inspired as we’ve been.
Material Of A Less Serious Nature
Two young boys walked into a pharmacy, picked out a box of tampons and proceeded to the checkout counter. The man at the counter asked the older boy, “Son, how old are you.”
“Eight,” the boy replied.
The man continued, “Do you know how these are used?”
The boy replied, “Not exactly, but they aren’t for me. They’re for him. He’s my brother. He’s four. We saw on TV that if you use these you will be able to swim and ride a bike—he can’t do either.”
Being an Angels and Giants fan, baseball has been over for me for two months. Now, I’m rooting for ABTDOY. That would be Anybody But The Dodgers Or Yankees. Oh man, I’m going to get some emails from clients now! But, it’s all in fun. I admire anyone who roots for their teams like I do. So, crow while you can crow. My 49ers and Oklahoma Sooners are 3-0. When SF beats the Rams and Seattle, then we’ll be REAL.
As always, the confidence and trust all of you place in us is greatly appreciated. Thank you.
Sincerely,

Bob Kargenian, CMT
President
TABR Capital Management, LLC (“TABR”) is an SEC registered investment advisor with its principal place of business in the state of California. TABR and its representatives are in compliance with the current notice filing and registration requirements imposed upon registered investment advisors by those states in which TABR maintains clients. TABR may only transact business in those states in which it is notice filed, or qualifies for an exemption or exclusion from notice filing requirements.
This newsletter is limited to the dissemination of general information pertaining to our investment advisory/management services. Any subsequent, direct communication by TABR with a prospective client shall be conducted by a representative that is either registered or qualifies for an exemption or exclusion from registration in the state where the prospective client resides. For information pertaining to the registration status of TABR, please contact TABR or refer to the Investment Advisor Disclosure web site (www.adviserinfo.sec.gov).
The TABR Model Portfolios are allocated in a range of investments according to TABR’s proprietary investment strategies. TABR’s proprietary investment strategies are allocated amongst individual stocks, bonds, mutual funds, ETFs and other instruments with a view towards income and/or capital appreciation depending on the specific allocation employed by each Model Portfolio. TABR tracks the performance of each Model Portfolio in an actual account that is charged TABR’s investment management fees in the exact manner as would an actual client account. Therefore the performance shown is net of TABR’s investment management fees, and also reflect the deduction of transaction and custodial charges, if any.
Comparison of the TABR Model Portfolios to the Vanguard Total Stock Index Fund, the Vanguard Total International Stock Fund and the Vanguard Total Bond Index Fund is for illustrative purposes only and the volatility of the indices used for comparison may be materially different from the volatility of the TABR Model Portfolios due to varying degrees of diversification and/or other factors.
Past performance of the TABR Model Portfolios may not be indicative of future results and the performance of a specific individual client account may vary substantially from the composite results above in part because client accounts may be allocated among several portfolios. Different types of investments involve varying degrees of risk, and there can be no assurance that any specific investment will be profitable.
The TABR Dividend Strategy presented herein represents back-tested performance results. TABR did not offer the Dividend Strategy as an investment strategy for actual client accounts until September/October 2014. Back-tested performance results are provided solely for informational purposes and are not to be considered investment advice. These figures are hypothetical, prepared with the benefit of hindsight, and have inherent limitations as to their use and relevance. For example, they ignore certain factors such as trade timing, security liquidity, and the fact that economic and market conditions in the future may differ significantly from those in the past. Back-tested performance results reflect prices that are fully adjusted for dividends and other such distributions. The strategy may involve above average portfolio turnover which could negatively impact upon the net after-tax gain experienced by an individual client. Past performance is no indication or guarantee of future results and there can be no assurance the strategy will achieve results similar to those depicted herein.
Inverse ETFs
An investment in an Inverse ETF involves risk, including loss of investment. Inverse ETFs or “short funds” track an index or benchmark and seek to deliver returns that are the opposite of the returns of the index or benchmark. If an index goes up, then the inverse ETF goes down, and vice versa. Inverse ETFs are a means to profit from and hedge exposure to a downward moving market.
Inverse ETF shareholders are subject to the risks stemming from an upward market, as inverse ETFs are designed to benefit from a downward market. Most inverse ETFs reset daily and are designed to achieve their stated objectives on a daily basis. The performance over longer periods of time, including weeks or months, can differ significantly from the underlying benchmark or index. Therefore, inverse ETFs may pose a risk of loss for buy-and-hold investors with intermediate or long-term horizons and significant losses are possible even if the long-term performance of an index or benchmark shows a loss or gain. Inverse ETFs may be less tax-efficient than traditional ETFs because daily resets can cause the inverse ETF to realize significant short-term capital gains that may not be offset by a loss.
For additional information about TABR, including fees and services, send for our disclosure statement as set forth on Form ADV from us using the contact information herein. Please read the disclosure statement carefully before you invest or send money.
A list of all recommendations made by TABR within the immediately preceding one year is available upon request at no charge. The sample client experiences described herein are included for illustrative purposes and there can be no assurance that TABR will be able to achieve similar results in comparable situations. No portion of this writing is to be interpreted as a testimonial or endorsement of TABR’s investment advisory services and it is not known whether the clients referenced approve of TABR or its services.