Should We (You) Fight The Fed?
This month, we’re taking a short break of our run of song-lyric headlines to focus on something that investors and advisors alike are struggling with. That is, what to do with bond allocations in perhaps what is the lowest yielding investment environment ever.
I believe it was the late Marty Zweig, one of Wall Street’s best money managers and technicians/quants during the 1990s, who coined the phrase, “Don’t Fight The Fed.” Meaning, that when the Federal Reserve is supporting financial markets, it’s almost always been bullish.
Skeptics have wondered when the Fed will run out of ammunition. My answer is, “I don’t know, but feel it will be at some point in time when investors lose confidence in what they are doing.” There’s no doubt that on March 23, the Fed’s actions of signaling they’ll do whatever it takes stopped the fastest decline in history in its tracks, and the Fed continues to support markets as they reach all-time highs.
These continuous bailouts continue to distort the market’s price signals for both stocks and bonds, and agree with their actions or not, we all have to figure out how to navigate a world where the Fed has publicly committed to keeping interest rates very low for a long time. Decent yields and low risk don’t exist today, so what does one do?
We’ll attempt to tackle that subject in the context of risk, along with a possible paradigm shift happening from growth to value, the positive vibe coming from the High-Low Logic Index, and a lesson in the mathematics of loss recovery. Read on.
What To Do About Bond Allocations
With investing, we don’t live in the long term, but have to be cognizant of it. The next 10 years, for instance, will be made up of several short-term trends. Just 11 months ago, the yield on the 10-year Treasury Note was 1.92%. By March 9, it had plunged to 0.49%, and today (November 13), sits at 0.89%. In bonds, there is a high positive correlation between the starting yield and future returns.
In other words, if you bought 10-year Treasury Notes today and held them, there’s a strong probability you’d earn less than 1% per annum for the next 10 years. At present, with inflation running at 1.2% year-over-year, one would be looking at losing money after inflation. Could this work? Let’s say one is trying to earn a net of 3.5% in a balanced portfolio in retirement which can meet one’s spending goals. Give me a moment, here. I realize younger investors in their 30s, 40s and 50s may want to earn higher returns being in the accumulation phase, but remember, all of us are playing with the same deck, no matter one’s age.
To one of the points we’re getting at, you’ll earn higher returns if you’ve allocated more to stocks than bonds, IF stocks perform well in the future. But if one is concerned about risk, as many retirees are (and certainly many accumulators), having a lot more in stocks usually means dealing with more volatility in both directions.
Using the typical 60% stock and 40% bond allocation that has been part of Wall Street for many years, if the bond portion only nets 0.36% each year (40% multiplied by 0.90% yield), then the stock portion must earn 5.24% annually (60% multiplied by 5.24% equals 3.14%, added to 0.36% from bonds equals 3.50%).
What’s the probability one can earn 5.25% compounded during the next 10 years in stocks? That depends on who you ask, and what methodology turns out to be correct. Unfortunately, the latter is impossible to know in advance. I surveyed six different research firms who publish future return forecasts, and the numbers were all over the map, especially when taking into consideration different asset classes, such as large company stocks, small company stocks, or foreign equities. See the summary below, which are using nominal returns (before inflation):
Grantham Mayo Large U.S. -3.6% Small U.S. -1.7% Int’l Large 1.2%
Research Affiliates Large U.S. 2.2% Small U.S. 5.2% EFA 7.3%
Hussman Strategic S&P 500 Index 0% or negative
Vanguard Large U.S. 3.7% Small U.S. 4.0% Global 7.4% U.S. High Yield 3.2%
AQR Large U.S. 6%
JP Morgan Large U.S. < 1% annually looking out 5 years
For large domestic stocks, with the exception of AQR, all forecasts are for less than 4% returns with two firms projecting negative returns. The outlook is slightly better for those that model small caps, and even better for foreign equities, though I should add that forecasts for foreign equities dominance vs the U.S. have been present for a number of years with nothing to show for it. At some point, though, just as you’ll see below in the discussion of growth and value, the cycle WILL change.
We track several valuation indicators from Ned Davis Research for U.S. stocks. Unequivocally, virtually all of them suggest that large company stocks are quite overvalued. One of them is displayed below, courtesy of NDR. The chart tracks stock market capitalization as a percentage of nominal gross domestic income, which is said to be Warren Buffet’s favorite indicator. In essence, it compares the value of stocks to the economy, with the thought in mind that stocks can’t grow faster than the economy FOREVER.
At present, the indicator is 65% above its long-term trendline growth, residing in the top quintile of historical readings. Stocks have only been more expensive using this approach in 1999-2000, and in the 1930s. Neither was a good time to be buying and holding stocks for 10 years, at least not large domestic stocks. As the table in the top clip shows, when in this mode historically, the average change in the S&P 500 Index ranging from one to nine years out was negative.

So, the possible outcomes from the more negative forecasts above aren’t necessarily that far-fetched. We should remember that the S&P 500 actually lost money, including dividends, from 1999 to 2009, before embarking on the bullish run that is seemingly still going on. I should also note, though, on a more optimistic note, that small and mid-cap stocks earned around 6% per annum during that period, and international stocks as measured by the Vanguard Total International Stock Index fund gained 2.3 percent in those 10 years.
As a result of these disparities, what you own in the way of stock asset classes (large, small, etc.) may be just as or even more important than HOW much you own.
Let’s switch back to the bond side. Up to now, we’ve assumed the use of government bonds in the illustrations above. Government bonds have usually provided positive returns when stocks have declined. That was certainly the case back in March, though now, most stock indexes have recovered to show gains year-to-date. That’s not been the case necessarily with corporate and municipal bonds, both of which have default risk, unlike governments.
Both asset classes fell sharply in March, as default risk skyrocketed until the Fed came in and saved the day. Corporate bonds, and especially high yield, are more correlated with stocks and don’t display the defensive characteristics of core bond funds during market declines. In the long term, high yield bond funds have provided higher returns than governments, but with more downside volatility, which is why we use risk models for this area, which happens to be TABR’s favorite.
In 2020, having very little in the way of core bonds in our portfolios has bitten us in the rear end, much like it did in 2008. In addition, researchers at Societe Generale recently analyzed the past 20 years of data and found that stocks and junk bonds have become more prone to fast gains and losses than ever before. We’ve certainly experienced this with our high yield bond fund risk model, which has been whipped around and given four different BUY signals since the end of March. In order to dampen this frequency and eliminate some of these “false” signals, we’ll need to expand our SELL disciplines a bit in order to stay with trends longer. This is one of the ramifications of Fed interventions in the bond market.
I don’t think, though, it’s necessary to settle for less than 1% on your bond allocations and stay entirely defensive in government bonds. By using investment grade core funds, high yield and other strategies such as used by PIMCO Income Fund (PIMIX), I believe it’s possible to achieve 3% returns on the bond side even from the current yield environment, which is extremely poor. And, yes, this strategy process comes with increased risk, but not nearly in the universe of -30% to -50% possible losses in the stock market.
For this exercise, I examined current yields in two large core bond funds, PIMCO Income, and three high yield bond funds that we use. On the core side, Vanguard Total Bond (VBMFX) currently has a duration of 6.5 years and yields 1.98% using the last three months of distributions and annualizing them. Loomis Core Plus Bond (NERYX) has a duration of 6.7 years and a yield of 2.23%. PIMCO Income’s (PIMIX) duration is 6 years with a distribution yield of 4%.
Within the high yield sector, Blackrock High Yield (BHYIX) currently yields 5.04%, with PIMCO High Yield (PHIYX) at 4.36% and Prudential High Yield (PHYZX) at 5.88%. Taking the average of those 3 equals 5.09%. Of course, that doesn’t mean one will earn 5% in these funds going out 5 years or more. There’s default risk. Though all three of these funds (and many others) are now positive for the year, at the bottom in late March, virtually the entire asset class was down -20%. That’s why TABR uses a risk model to get out. So, let’s assume the 5.09% above gets shaved down to 3.50%. Let’s further assume, for the sake of conservatism, that PIMCO Income earns a net of 3%, even though they are currently paying out 4%. Our allocations on the bond side, would look as follows:
Loomis Core Plus Bond 16% yield 2.20%
PIMCO Income 17% return 3.00%
High Yield Funds 67% return 3.50%
With the above weightings, the combined return comes to 3.20%. That’s a heck of a lot better than 0.89% on a 10-year Treasury. More importantly, look at what this does to the overall needed contribution from the equity side of the allocation. Remember the target return above of 3.5%? Using all government bonds required a 5.24% return from the equity side, assuming 60% in stocks.
But, even using 45% in bonds instead of 40%, with a 3.2% return, the stock side now only needs to equal 3.75%. That’s a lot more plausible from current elevated valuations than 5.25%.
In sum, we know that stock market valuations have skewed higher since 1995, and its possible they will remain elevated for a long time. The past may not represent the future. No doubt the Fed is a powerful force, and seems committed to supporting financial markets no matter what. It’s not wise to fight the Fed, but I also don’t think one must substantially ramp up stock exposure at current levels in order to meet long-term return goals. In my view, a carefully employed bond market strategy may turn out to be more competitive than many industry experts think going forward, in the event that some of the more negative stock market forecasts come to fruition, at least until stock prices provide a better risk/reward point.
A Paradigm Shift? Growth To Value?
Much has been written about the concentration of strength in large company growth shares (think Apple, Amazon, Facebook, etc), and the disparity in performance of growth stocks versus value stocks. That’s best illustrated in chart form. The chart below shows the S&P 500 Growth Index compared to the S&P 500 Value Index, courtesy of Ned Davis Research.
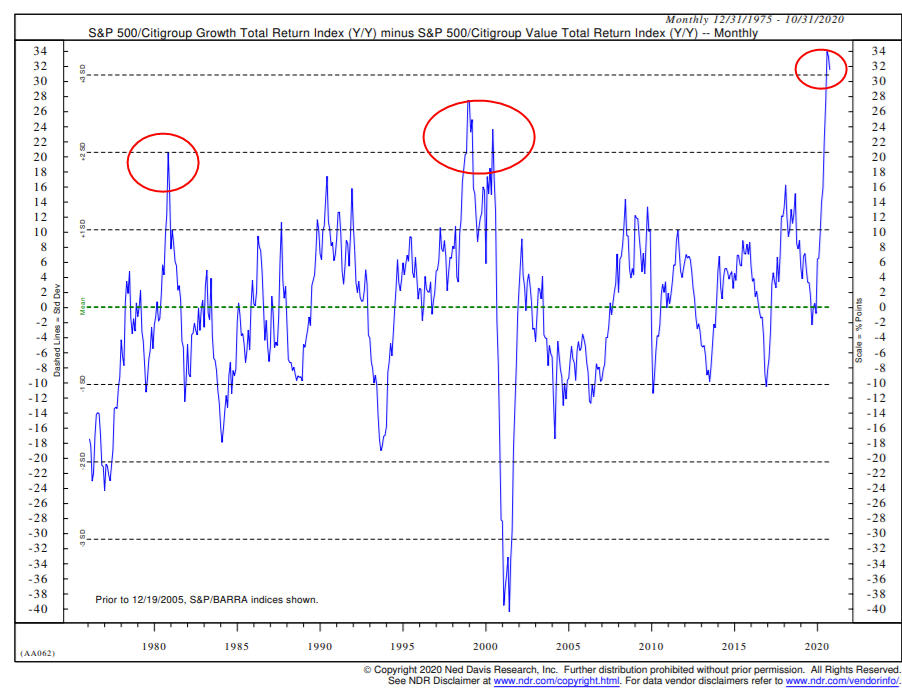
In the 12 months ended October 31, growth has outperformed value by over 31%, the greatest margin in the 45-year history of the data, and what statisticians term a three-standard deviation event. It’s possible this goes on for many more months, or not, but as history shows, it will end, and quite possible with a move in the opposite direction of substance. As the table below shows, since the September 2 peak in stocks, which has just been exceeded by the S&P 500, there’s been a decided shift taking place, with small caps, mid-caps, international and dividend-oriented issues leading, while the large cap growth issues are going the other direction.
| Index | September 2, 2020 | November 13, 2020 | Net Change |
| S&P 500 Index | 3580.80 | 3585.10 | 0.12% |
| Nasdaq 100 Index (QQQ) | 302.76 | 290.93 | -3.90 |
| S&P 400 Midcap Index | 1966.4 | 2113.2 | 7.46 |
| S&P 600 Smallcap Index (IJR) | 75.68 | 81.73 | 7.99 |
| EFA International Index | 65.92 | 69.37 | 5.23 |
| S&P Dividend ETF (SDY) | 98.19 | 103.60 | 5.50 |
| Facebook (FB) | 302.50 | 276.95 | -8.44 |
| Apple (AAPL) | 131.40 | 119.26 | -9.23 |
| Netflix (NFLX) | 552.84 | 482.84 | -12.66 |
| Microsoft (MFST) | 231.65 | 216.51 | -6.53 |
| Amazon (AMZN) | 3531.4 | 3128.80 | -11.40 |
| Google (GOOG) | 1728.20 | 1777 | 2.82 |
This change is less than 3 months old, and bears watching. It’s certainly not been enough to change our relative strength rankings, which blend short-term strength with intermediate and long-term strength. But, confirmation or lack thereof will be telegraphed by the chart of the Nasdaq 100 Index, also known as the QQQ. See the chart below, courtesy of www.stockcharts.com.

There is definite resistance at the 3000 level of the index, and support between 2600 and 2700, the former being the low in mid-September. A breakout above 3000 would make a higher high, and continue the pattern in place since the March lows. A breakdown, though, would mean lower lows and likely confirmation of a change in trend. I very much agree with the sentiments expressed earlier this year by writer and money manager Vitaliy Katsenelson on this subject. He wrote “One thing I am sure about is that this is not the new normal or the forever-state of the market. Here is what I know: Every bubble has burst. Every single one! In a speculative phase, everyone who is buying overvalued stocks is counting on a greater fool to buy even more overvalued stocks for higher prices in the future. At some point the stock market runs out of greater fools. It’s that simple.”
Near Term, Highs And Lows Are Bullish
The above warning is about the longer term. But, as noted above, we live in the short term. In that realm, all five of our stock market risk models are bullish, as well as our high yield corporate bond model, so equity allocations are 100% in stocks and we have a full position in high yield bond funds. The stock market is being supported by both a maintenance and expansion of stocks making new highs, and importantly, a small number of stocks making new lows. Market analyst Norman Fosback created the High Low Logic Index in the 1970s. Its calculated by taking the lesser number of new highs or new lows, and dividing by the total number of issues traded.
The concept behind the indicator is that either a large number of stocks will make new highs or a large number will make new lows, but normally not both at the same time. When high readings occur, it suggests that market internals are inconsistent, and is considered bearish for stock prices. On the other hand, extremely low readings reveal a uniform market, and are considered bullish. Below is how the indicator has behaved since 1987, the chart again courtesy of NDR.
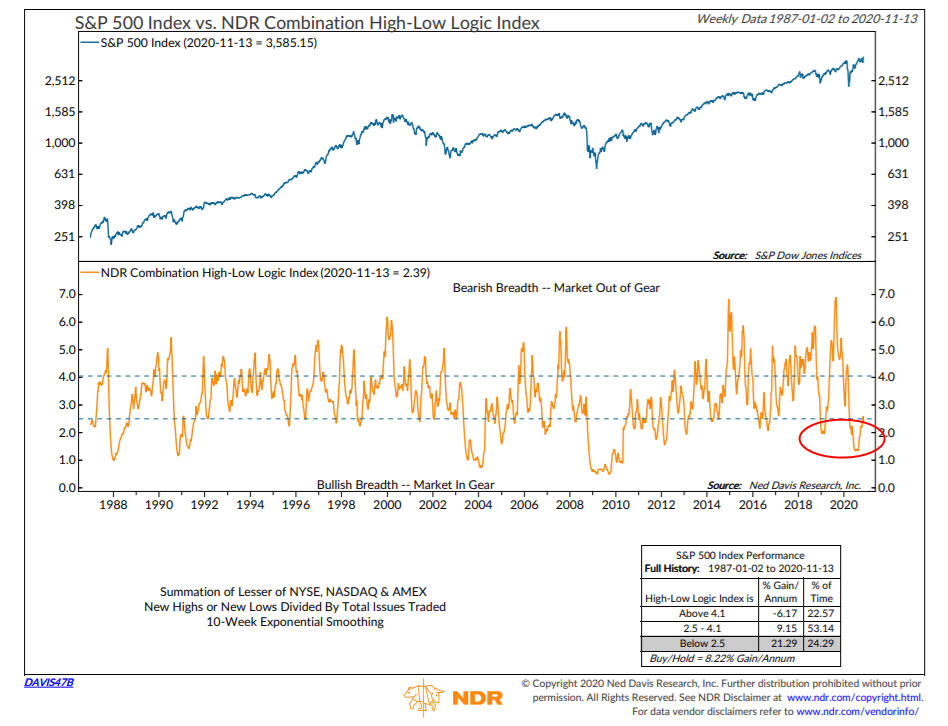
Despite some indexes being at new highs, the index is still in its Bullish mode, which it entered in March, after correctly warning of trouble in January. You can also see it flashed correct warnings of trouble in 1999-2000, again in 2007-2008 and in 2015-16. Last week on November 9, both the number of stocks making new highs on the NYSE and Nasdaq either matched or exceeded their prior peaks in January/February. This is more confirmation of good and expanding breadth, and suggests prices are going higher, with one technical projection from some research we get targeting the 3880 level in the S&P 500. As I write this, the index is trading at 3616, so that’s 7% above current levels. We’ll see. In markets, there are never guarantees, other than that they seem to always surprise us.
The Mathematics of Loss Recovery (A Recent Example)
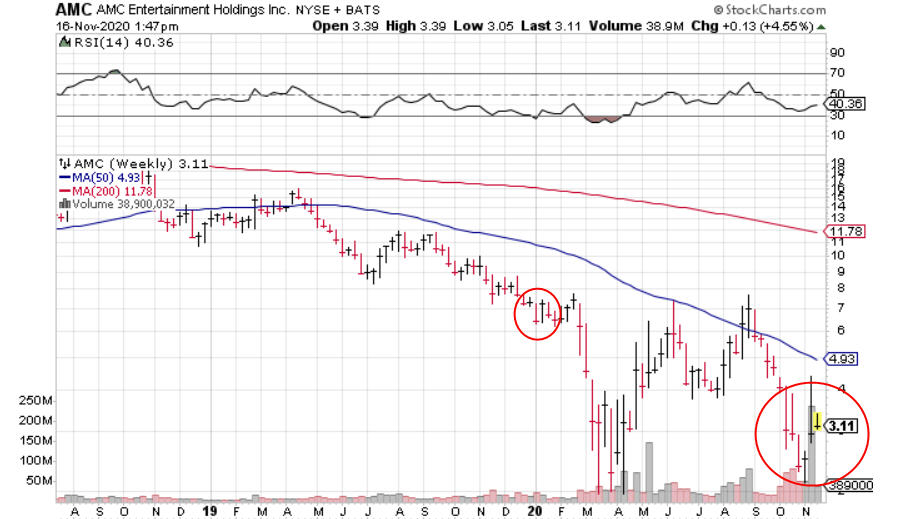
Remember your statistics class? If you lose 50% of your capital, then gain 50% back, you’re not back to even, are you? Start with $50,000, now you’re at $25,000 (a 50% loss). Then, gain 50% on the $25,000, and you’re only back to $37,500. Yes, if you lose 50%, you actually need to double your money to get back to even. Last Monday, when Pfizer announced their vaccine trials were showing 90% effectiveness, a host of stocks that have been battered much of the year absolutely soared. Many of them gained 15-25% or more. One of them, whom many are familiar with if you are a movie-goer, was AMC Theatres, which unfortunately has nearly been put out of business thanks to the Covid virus. Well, on November 9, AMC stock went up 51% in one day. Holy cow! Yes, from 2.49 to 3.77. And yet, as the chart below shows from www.stockcharts.com, the stock is still down -58% for the year.
Needless to say, gains and losses in individual stocks are much greater than with broad stock indexes, which makes risk management and a plan even more important. Because U.S. stocks generally go up over time, one can invest regularly and buy and hold, and in most cycles do OK to very well (except for a 1999-2009 like time period). That’s not the case with companies. Expectations change, and so does psychology, even with the best of the best. Obviously, Apple, Facebook, Amazon and Netflix aren’t going out of business anytime soon. But, that doesn’t mean their stock prices will be higher three years from now.
Material Of A Less Serious Nature
Remember this story when a negative person makes your life miserable!
A woman was at her hairdresser’s getting her hair styled for a trip to Rome with her boyfriend. She mentioned the trip to the hairdresser, who responded, “Rome? Why would anyone want to go there? It’s crowded and dirty and full of Italian’s. You’re crazy to go to Rome. So, how are you getting there?”
“We’re taking Continental,” was the reply. “We got a great rate.”
“Continental?” exclaimed the hairdresser. “That’s a terrible airline. Their planes are old, their flight attendants are ugly, and they’re always late. So, where are you staying in Rome?”
“We’ll be at this exclusive little place over on Rome’s Tiber River called Teste.”
“Don’t go any further. I know that place. Everybody thinks it’s gonna be something special and exclusive, but it’s really a dump, the worst hotel in the city! The rooms are small, the service is surly and they’re overpriced. So, whatcha doing when you get there?”
“We’re going to go see the Vatican and we hope to see the Pope.”
“That’s rich,” laughed the hairdresser. “You and a million other people trying to see him. He’ll look the size of an ant. Boy, good luck on this lousy trip of yours. You’re going to need it!”
A month later, the woman again came in for a hairdo. The hairdresser asked her about her trip to Rome.
“It was wonderful,” explained the woman. “Not only we were on time in one of Continental’s brand new planes, but it was overbooked and they bumped us up to first class. The food and wine were wonderful and I had a handsome 28-year-old steward who waited on me hand and foot. And the hotel was great!
“They’d just finished a $5 million remodeling job and now it’s a jewel, the finest hotel in the city. They, too, were overbooked, so they apologized and gave us their owner’s suite at no extra charge!”
“Well,” muttered the hairdresser, “That’s all well and good, but I know you didn’t get to see the Pope.”
“Actually, we were quite lucky, because as we toured the Vatican, a Swiss Guard tapped me on the shoulder and explained that the Pope likes to meet some of the visitors. He asked if I’d be so kind as to step into his private room and wait, the Pope would personally greet me. Sure enough, five minutes later, the Pope walked through the door and shook my hand! I knelt down and he spoke a few words to me.”
“Oh, really! What’d he say?”
He said, “Where’d you get the shi$$tty hairdo?”
I hope you got a chuckle out of that. This has been a difficult and challenging year for most all of us, with jobs and livelihoods threatened and affected by an invisible once-in-a century virus. As one client mentioned recently, this is an endurance test, and it’s certainly not over, with what we all considered “normal” not likely until perhaps late next year. Amidst all of this, we enter the season of Thanksgiving and gratitude for all we have, and pray that you will find some peace among the chaos that we call the year of 2020. From all of us at TABR, thanks for allowing us to serve you, and your confidence in us.
Sincerely,

Bob Kargenian, CMT
President
TABR Capital Management, LLC (“TABR”) is an SEC registered investment advisor with its principal place of business in the state of California. TABR and its representatives are in compliance with the current notice filing and registration requirements imposed upon registered investment advisors by those states in which TABR maintains clients. TABR may only transact business in those states in which it is notice filed, or qualifies for an exemption or exclusion from notice filing requirements.
This newsletter is limited to the dissemination of general information pertaining to our investment advisory/management services. Any subsequent, direct communication by TABR with a prospective client shall be conducted by a representative that is either registered or qualifies for an exemption or exclusion from registration in the state where the prospective client resides. For information pertaining to the registration status of TABR, please contact TABR or refer to the Investment Advisor Disclosure web site (www.adviserinfo.sec.gov).
The TABR Model Portfolios are allocated in a range of investments according to TABR’s proprietary investment strategies. TABR’s proprietary investment strategies are allocated amongst individual stocks, bonds, mutual funds, ETFs and other instruments with a view towards income and/or capital appreciation depending on the specific allocation employed by each Model Portfolio. TABR tracks the performance of each Model Portfolio in an actual account that is charged TABR’s investment management fees in the exact manner as would an actual client account. Therefore the performance shown is net of TABR’s investment management fees, and also reflect the deduction of transaction and custodial charges, if any.
Comparison of the TABR Model Portfolios to the Vanguard Total Stock Index Fund, the Vanguard Total International Stock Fund and the Vanguard Total Bond Index Fund is for illustrative purposes only and the volatility of the indices used for comparison may be materially different from the volatility of the TABR Model Portfolios due to varying degrees of diversification and/or other factors.
Past performance of the TABR Model Portfolios may not be indicative of future results and the performance of a specific individual client account may vary substantially from the composite results above in part because client accounts may be allocated among several portfolios. Different types of investments involve varying degrees of risk, and there can be no assurance that any specific investment will be profitable.
The TABR Dividend Strategy presented herein represents back-tested performance results. TABR did not offer the Dividend Strategy as an investment strategy for actual client accounts until September/October 2014. Back-tested performance results are provided solely for informational purposes and are not to be considered investment advice. These figures are hypothetical, prepared with the benefit of hindsight, and have inherent limitations as to their use and relevance. For example, they ignore certain factors such as trade timing, security liquidity, and the fact that economic and market conditions in the future may differ significantly from those in the past. Back-tested performance results reflect prices that are fully adjusted for dividends and other such distributions. The strategy may involve above average portfolio turnover which could negatively impact upon the net after-tax gain experienced by an individual client. Past performance is no indication or guarantee of future results and there can be no assurance the strategy will achieve results similar to those depicted herein.
Inverse ETFs
An investment in an Inverse ETF involves risk, including loss of investment. Inverse ETFs or “short funds” track an index or benchmark and seek to deliver returns that are the opposite of the returns of the index or benchmark. If an index goes up, then the inverse ETF goes down, and vice versa. Inverse ETFs are a means to profit from and hedge exposure to a downward moving market.
Inverse ETF shareholders are subject to the risks stemming from an upward market, as inverse ETFs are designed to benefit from a downward market. Most inverse ETFs reset daily and are designed to achieve their stated objectives on a daily basis. The performance over longer periods of time, including weeks or months, can differ significantly from the underlying benchmark or index. Therefore, inverse ETFs may pose a risk of loss for buy-and-hold investors with intermediate or long-term horizons and significant losses are possible even if the long-term performance of an index or benchmark shows a loss or gain. Inverse ETFs may be less tax-efficient than traditional ETFs because daily resets can cause the inverse ETF to realize significant short-term capital gains that may not be offset by a loss.
For additional information about TABR, including fees and services, send for our disclosure statement as set forth on Form ADV from us using the contact information herein. Please read the disclosure statement carefully before you invest or send money.
A list of all recommendations made by TABR within the immediately preceding one year is available upon request at no charge. The sample client experiences described herein are included for illustrative purposes and there can be no assurance that TABR will be able to achieve similar results in comparable situations. No portion of this writing is to be interpreted as a testimonial or endorsement of TABR’s investment advisory services and it is not known whether the clients referenced approve of TABR or its services.