Should You Really Be Worried About A Credit Bubble, OMG She’s In High School, Drawdowns And More
I am a voracious reader. I love newspapers (yes, real ones, not the digital versions), magazines, books and various publications, from stock market research to The Athletic, a godsend for sports fans nationwide where you can keep up daily with all of your favorite teams with the best sports writers in the nation, all for less than $70 annually.
Reading is where I get most of my ideas for subjects to write about. But often, those subjects come about from interactions with clients, when they make certain comments, or ask certain questions. This month’s lead story came from exactly that source, our clients, when a couple of them cited a recent article by John Mauldin, a frequent financial writer and publisher.
The gist of Mauldin’s piece is that we as a nation and the credit markets have a record amount of debt, we have a credit “bubble” and that someday soon, all this stuff is going to come crashing down and the bond market is going to fall apart.
Well, these clients own a lot of bonds (bond funds, to be exact), and were wondering about our thoughts. Great question. To be transparent, we as a firm own a lot of bond funds, in the range of about $65-70 million on behalf of our clients, and about 50% of the total assets we manage.
Read on for our thinking, a reminder of how our process handles the bond market, and why we should be hoping for a credit bubble.
In addition, it’s graduation time for many, including our family, so we’re sharing a brief update on our daughter, Caroline, along with a great partial piece from Make Your Bed that you’ll not want to miss.
Finally, we’ll touch on Drawdowns and Recovery, and the actual results from our tactical and passive portfolios during the recent 4th quarter decline and early 2019 rebound in the stock market.
We Should Hope For A Credit Bubble
There’s little doubt that there is more outstanding debt today than ever before. And, it’s certainly problematic when an economic theory (if that is what you call it) called MMT (Modern Monetary Theory) is gaining more mainstream attention for its notion that a government can just continue printing money and buying assets with no future consequence.
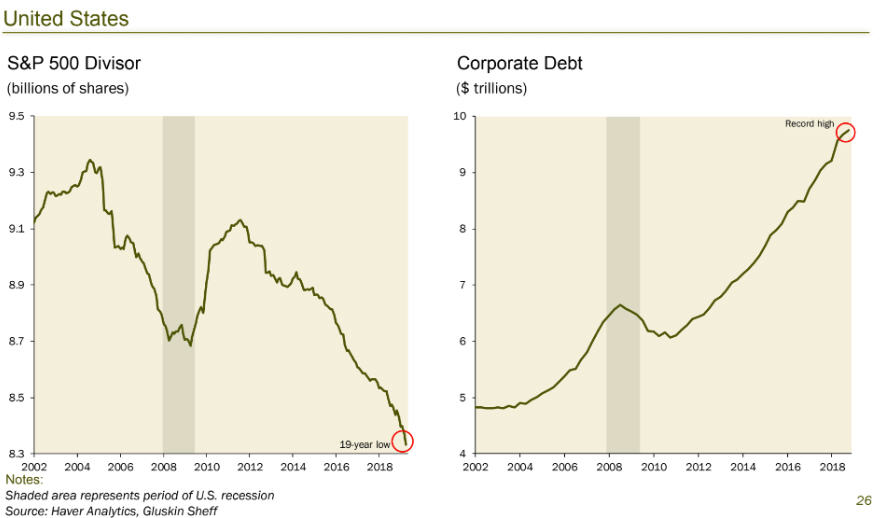
Below are two charts, courtesy of Haver Analytics and Gluskin Sheff. You can see the growth in corporate debt with the chart on the right. Much of this debt has been used to buy back stock, with the chart on the left showing an almost -9% contraction in the number of shares of S&P 500 companies during the last 17 years.
But it would be folly to even think about making serious investment changes based on this flimsy evidence. Why? Because no one knows how things will turn out. For some recent evidence, just look at the first five months, when 20 analysts at the end of 2018 predicted where the yield on the 10-year Treasury Note would be at the end of June. The range was a low of 2.5% and a high of 3.75% (the yield began the year at 2.89%). Where is it as I write this? It’s at 2.10%. Not one of them was even close.
Instead of worrying about what could happen, we think it’s better to simply have a process that deals with what IS happening. The risk models we use for the bond market are price driven, and they’re not static. They’re adaptive.
I believe the thought process that is behind the “credit bubble” theory is that with this massive amount of debt, once a recession hits (and one is overdue), gobs of companies will have trouble making their interest payments, and corporate bond prices will get crushed. Let’s hope so, because with yields in the low 3% range on higher quality debt, and around 5.5% on high yield debt (an oxymoron if there ever was one), bond investors are not getting adequately compensated for the risk.
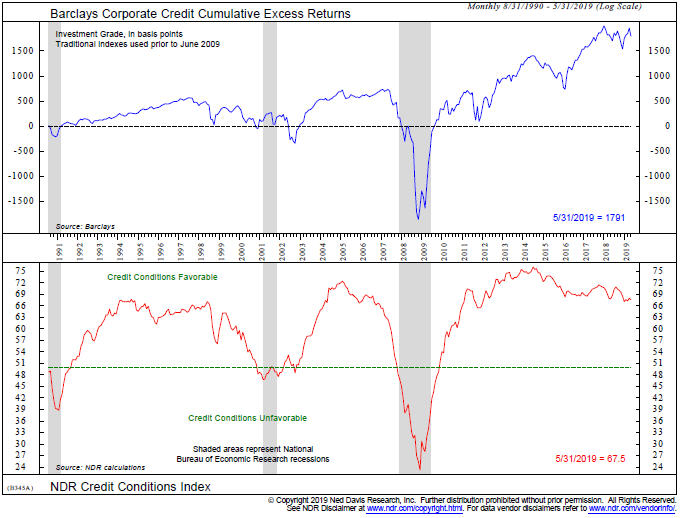
Yet, other than an inverted yield curve the last few weeks, there are few reliable signs of an oncoming recession. The chart below depicts the Ned Davis Research Credit Conditions Index (courtesy of www.ndr.com). It’s nowhere near the levels that have been associated with the three recessions that have taken place since 1990.
Nor is there stress in the high yield, or junk bond market. Prices are at their highest level of the year and for the recovery that began in late December (see chart below of the PIMCO High Yield Fund, one of the high yield funds we own for clients).
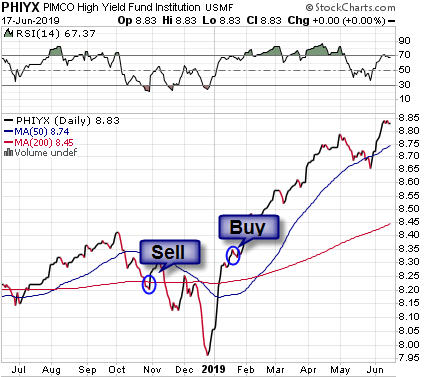
The BUY signal that was generated in mid-January from our high yield bond fund risk model is now over five months old. Sometimes signals last for only a few months, like last fall. Other times, they can last over a year, such as the one from January 2017 to February 2018. Historically, the odds are high that our model will generate a SELL sometime in the next 6-7 months. When that happens, the corporate bond market will be in a much more precarious position. I should add that bad things don’t happen after every SELL signal, but every significant decline has taken place AFTER a SELL signal.
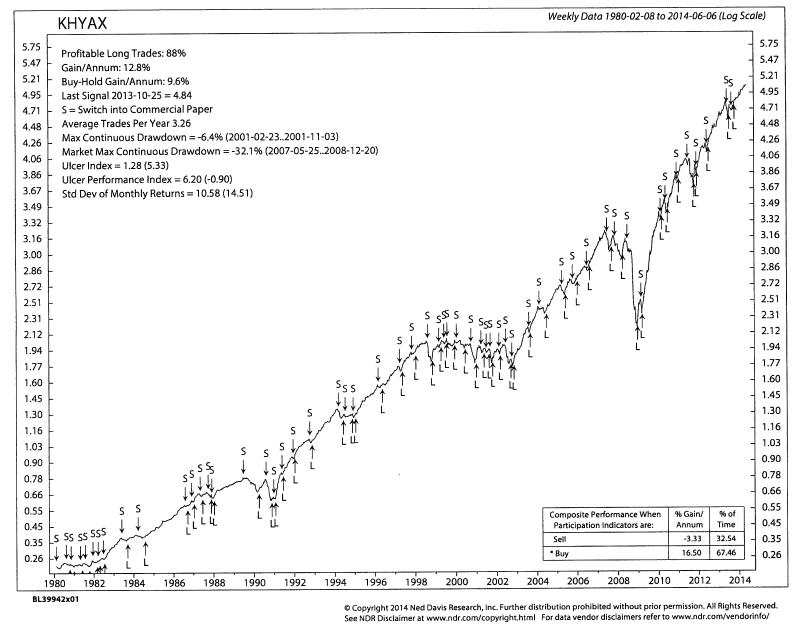
Below is a hypothetical chart of our model’s methodology as applied to the DWS High Income Fund. We’ve been using the same model and parameters on weekly data since 2004, but have not owned this particular fund. We use it as an example because it is one of the few high yield corporate bond funds that existed back in 1980. See the maximum decline in the fund of -32% in the 2007-08 period? We should hope for something similar, so there’s actually a HIGH in High Yield. Heck, I would take a -20% decline. Why? Although there are no guarantees, I am confident that our model will perform really well, just as it has in the past, thus far limiting maximum drawdowns to less than -7%.
Above, I noted the inverted yield curve, which is getting a lot of attention in the press. This is when short term rates are above longer term rates. According to research by Cam Harvey, a Professor at Duke University whose original research on the yield curve was published in the 1980s, the inverted yield curve has never given a false signal of predicting a recession over the last 60 years. Below is a chart going back to 2007 which depicts the curve, which is the yield on 3-month Treasury Bills minus the yield on the 10-year Treasury Note. The chart is courtesy of www.stockcharts.com.
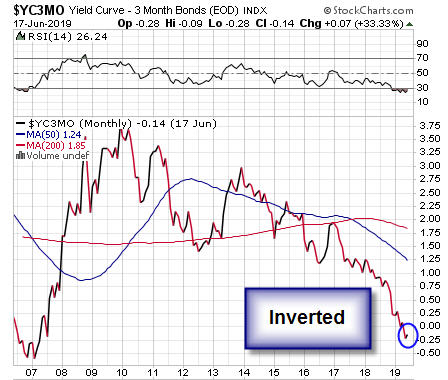
In recent weeks, the curve has inverted, the first time this has happened since 2007. According to Harvey in his dissertation, he stated that the inversion must be sustained at least over a full quarter—just inverting for a couple of days or a week is not enough. That hasn’t happened yet, so this relationship bears watching during the next couple of months.
There is substantial pressure on the Federal Reserve Board to cut interest rates, especially from President Trump. It was very clear during the fourth quarter stock market decline that the financial markets cannot handle interest rates above 3%. There’s simply too much debt, and the cost of servicing that debt grows exponentially with higher rates. In a recession, yields are likely to go in very different directions, depending on the kind of debt. Corporate yields may rise significantly, as there is always the growing risk of default, but government bond yields will almost certainly decline, because they are deemed safer, and likely the Fed will cut rates to try and boost the economy.
I would love to see higher government bond yields. It is nice to finally earn 2% plus risk-free on money market funds. But, don’t be surprised if they once again become a thing of the past, as it is very likely the Fed would cut rates once again to zero if they have to. In sum, I have no idea if we have a credit bubble and what may happen. But, I’ll say this. We’re not worried about one, because we know how our process works, and if it does happen, there will be tremendous opportunities to buy junk bonds at much lower prices (higher yields). The real risk to a credit bubble (in bonds and stocks) is to those investors and advisers who mostly advocate a buy and hold, do nothing approach. That’s not us.
OMG, She’s In High School!
A number of clients have been with us for 20 years or more, and in some cases 30 years plus, back to the days when I started with E.F. Hutton in Whittier. It touches us when someone says they have all the Christmas pictures we’ve sent over the years, as they see our kids grow up. Well, that story is still developing, as our daughter Caroline (14), just completed her 11th year at Heritage Oak Private Elementary in Yorba Linda, and is already enmeshed as a freshman at Orange Lutheran High School in Orange. Below is from graduation night a week ago.

Since we’re on this subject, many of you will ask me, “So, how’s Adam doing?” Two years ago he graduated from New York University with his degree in Photography. He has a strong interest in music and fashion, and as a number of our clients will attest who work in the arts, it can be a difficult slog to get established and find traction. Right now, he’s in the middle of a 12-day, six city tour, shooting video and photos for Israeli musician, singer and songwriter Dennis Lloyd. This is a first, and hopefully will lead to many more opportunities.
Please, Make Your Bed!
Since it’s graduation time, I thought we’d re-visit the commencement speech given back in 2014 by Naval Admiral William H. McRaven at the University of Texas, which was part of his terrific book, Make Your Bed. We liked the book so much, it was our annual offering of gratitude last November to clients. Below is the first part of his speech. If you’ve not read the book yet, maybe this will spur you on. We’ve provided links at the bottom for the remainder of it, as well as a link to the You Tube video of his live speech. The book is worth every penny of its $18 cover price, and makes a wonderful gift for the graduates in your life. Here goes:
The University’s slogan is, “What starts here changes the world.” I have to admit—I kinda like it. “What starts here changes the world.”
Tonight there are almost 8,000 students graduating from UT. That great paragon of analytical rigor, Ask.com says that the average American will meet 10,000 people in their lifetime. That’s a lot of folks.
But, if every one of you changed the lives of just ten people–and each one of those folks change the lives of another ten people–just ten–then in five generations–125 years–the class of 2014 will have changed the lives of 800 million people.
800 million people–think of it–over twice the population of the United States. Go one more generation and you can change the entire population of the world–8 billion people.
If you think it’s hard to change the lives of ten people–change their lives forever–you’re wrong. I saw it happen every day in Iraq and Afghanistan.
A young Army officer makes a decision to go left instead of right down a road in Baghdad and the ten soldiers in his squad are saved from close-in ambush.
In Kandahar province, Afghanistan, a non-commissioned officer from the Female Engagement Team senses something isn’t right and directs the infantry platoon away from a 500 pound IED, saving the lives of a dozen soldiers.
But, if you think about it, not only were these soldiers saved by the decisions of one person, but their children yet unborn–were also saved. And their children’s children–were saved. Generations were saved by one decision–by one person.
But changing the world can happen anywhere and anyone can do it. So, what starts here can indeed change the world, but the question is…what will the world look like after you change it?
Well, I am confident that it will look much, much better, but if you will humor this old sailor for just a moment, I have a few suggestions that may help you on your way to a better world.
And while these lessons were learned during my time in the military, I can assure you that it matters not whether you ever served a day in uniform. It matters not your gender, your ethnic or religious background, your orientation, or your social status. Our struggles in this world are similar and the lessons to overcome those struggles and to move forward–changing ourselves and the world around us–will apply equally to all.
I have been a Navy SEAL for 36 years. But it all began when I left UT for Basic SEAL training in Coronado, California. Basic SEAL training is six months of long torturous runs in the soft sand, midnight swims in the cold water off San Diego, obstacles courses, unending calisthenics, days without sleep and always being cold, wet and miserable. It is six months of being constantly harassed by professionally trained warriors who seek to find the weak of mind and body and eliminate them from ever becoming a Navy SEAL.
But, the training also seeks to find those students who can lead in an environment of constant stress, chaos, failure and hardships. To me basic SEAL training was a lifetime of challenges crammed into six months.
So, here are the ten lessons I learned from basic SEAL training that hopefully will be of value to you as you move forward in life.
Every morning in basic SEAL training, my instructors, who at the time were all Vietnam veterans, would show up in my barracks room and the first thing they would inspect was your bed.
If you did it right, the corners would be square, the covers pulled tight, the pillow centered just under the headboard and the extra blanket folded neatly at the foot of the rack–rack–that’s Navy talk for bed.
It was a simple task–mundane at best. But every morning we were required to make our bed to perfection. It seemed a little ridiculous at the time, particularly in light of the fact that we’re aspiring to be real warriors, tough battle hardened SEALs–but the wisdom of this simple act has been proven to me many times over.
If you make your bed every morning you will have accomplished the first task of the day. It will give you a small sense of pride and it will encourage you to do another task and another and another.
By the end of the day, that one task completed will have turned into many tasks completed. Making your bed will also reinforce the fact that little things in life matter.
If you can’t do the little things right, you will never do the big things right.
And, if by chance you have a miserable day, you will come home to a bed that is made–that you made–and a made bed gives you encouragement that tomorrow will be better.
# 1. If you want to change the world, start off by making your bed. *
The remainder of the address can be found at http://www.lifebuzz.com/10-lessons-from-navy-seal/#!RS2FD
Should you want to view the live speech he gave, go to this link:
Drawdowns, And Different Paths
We’ve mentioned in previous communication the V-shaped nature of the recovery in the stock market after the fourth quarter decline, which in hindsight began with large cap stocks peaking on September 20. On a closing basis, the S&P 500 Index has not suffered a -20% decline from a peak since 2007-08. There have been two near misses in 2011 and 2018. Other stock indexes, such as small caps and international equities have suffered more damage during these periods.
I thought it would be instructive to show the depth of the recent decline, and the recovery to a new high, while comparing the performance of 4 of TABR’s portfolio strategies, in relation to the S&P 500. The period involved is September 20, 2018, when the index peaked, to December 24, 2018, the bottom of the decline, and finally to May 3, 2019, when the index made a new recovery high at the 2945 level. As I write this, the index is trading at 2893, less than 2% below its high.
| S&P 500 Index | TABR Moderate | TABR Conservative | TABR Passive | TABR DividendStk | |
| 9-20-18 | 2930.75 | $852,473 | $229,594 | $185,012 | $132,657 |
| 12-24-18 | 2351.10 | $800,415 | $219,180 | $162,166 | $119,214 |
| Loss | -19.77% | -6.10% | -4.53% | -12.34% | -10.13% |
| 5-3-19 | 2945.64 | $856,576 | $232,772 | $188,365 | $135,414 |
| Gain | +25.28% | +7.01% | +6.20% | +16.15% | +13.58% |
| Net Gain | +1.63% | +0.48% | +1.38% | +1.81% | +2.07% |
Please note that the figures cited for the S&P 500 are price only, except for the net gain during the entire period, which does include reinvested dividends. The figures for the 4 TABR strategies are net of management fees.
One can see there was almost a -20% decline in the index, which of course is made up of 100% stocks. The Passive account is 60% in stocks and 40% in bonds. The Moderate account is 50% stock and 50% bonds, while the Conservative account is 35% stock and 65% bonds, and both are tactical, in that the exposure to stocks is not constant as it is in the Passive account, but is adjusted in accordance with our risk models. This is also true of the Dividend Stock account, which invests exclusively in individual stocks, but is not always 100% invested.
During this period, the invested exposure to the stock market in our tactical accounts was 50% at the September 20 high, dropped to 38% in late October and then as low as 14% and even zero in late December, and then was back to 85% by mid-February. TABR’s Dividend Stock account has a 40% floor for exposure, which was reached during the fourth quarter, and then like our tactical accounts, rebounded in early 2019 to be nearly fully invested.
You can see there is very little difference in the net gain of any of the five strategies during this period. TABR’s Passive and Dividend Stock strategies actually outperformed slightly the gains of the S&P 500 Index, but that is not the point we’re trying to make. Focus on the loss from the peak in September to the low on Christmas Eve.
The maximum losses of our Moderate and Conservative accounts, compared to the S&P 500 Index, were -69% less for Moderate, and -77% lower for Conservative, yet there was very little give up in the way of gains. That’s what we’re trying to emphasize. Risk management during significant declines is critical in our view, and this is another real example of our process. Remember, this isn’t going to add value in a market that is mostly rising. And we know that historically, markets are rising about 75% of the time. Our process is like life insurance. When you really need it, it is there, because you cannot afford to let your portfolio die.
At some point, we’ll have a decline that is greater than -20%, and markets won’t necessarily rebound in 3 months. We need to be alert. Sometimes the best of times may be a breeding ground for the worst of times.
Current Portfolio Allocations And Outlook
At present, our tactical equity exposure is at 70%, which we consider to be moderately bullish. The daily advance/decline line just made another new all-time high, so the odds continue to favor large cap indexes like the Dow Industrials and S&P 500 eventually reaching new highs in coming weeks or months. That’s only about 2% higher, and after that, who knows. We’ll let our models react.
The bond market is telling the story that the Federal Reserve will soon cut interest rates, since the Fed Funds rate is trading above where 3-month Treasury Bills are now yielding. What we don’t know is what the market’s reaction will be to this development. As noted above, our high yield bond risk model remains in its Bullish mode, with prices making new highs this past week. That’s certainly not negative, but as we explained to a few clients this past week, the bond market is no longer as attractive today as it was back in early January and late December.
Material Of A Less Serious Nature
Lisa was driving home from one of her business trips in Northern Arizona when she saw an elderly Navajo woman walking on the side of the road. Lisa stopped the car and asked the woman if she would like a ride. With a silent nod of thanks, the Navajo woman got in the car.
As they drove along, Lisa tried in vain to make a bit of small talk. The woman just sat silently studying the desert landscape as it passed. Finally, the Navajo woman motioned to a brown bag sitting on the backseat. “What’s in the bag?” asked the old woman.
Lisa glanced in the backseat and said, “Oh, it’s a bottle of wine. I got it for my husband.”
The Navajo woman was silent for another moment or two. Then, speaking with the quiet wisdom of an elder, she said, “Good trade.”
Here’s hoping our trading for the next 6 months is as productive as it has been for the first six months of 2019. Summer’s upon us. Enjoy it, and go watch some baseball, even if your team(s) stink, like mine do. Maybe the Angels will have a miraculous second half. And maybe not. But at least I know my SF 49ers open camp in late July! Thanks as always for the continued trust and confidence you place in all of us at TABR.
Sincerely,

Bob Kargenian, CMT
President
TABR Capital Management, LLC (“TABR”) is an SEC registered investment advisor with its principal place of business in the state of California. TABR and its representatives are in compliance with the current notice filing and registration requirements imposed upon registered investment advisors by those states in which TABR maintains clients. TABR may only transact business in those states in which it is notice filed, or qualifies for an exemption or exclusion from notice filing requirements.
This newsletter is limited to the dissemination of general information pertaining to our investment advisory/management services. Any subsequent, direct communication by TABR with a prospective client shall be conducted by a representative that is either registered or qualifies for an exemption or exclusion from registration in the state where the prospective client resides. For information pertaining to the registration status of TABR, please contact TABR or refer to the Investment Advisor Disclosure web site (www.adviserinfo.sec.gov).
The TABR Model Portfolios are allocated in a range of investments according to TABR’s proprietary investment strategies. TABR’s proprietary investment strategies are allocated amongst individual stocks, bonds, mutual funds, ETFs and other instruments with a view towards income and/or capital appreciation depending on the specific allocation employed by each Model Portfolio. TABR tracks the performance of each Model Portfolio in an actual account that is charged TABR’s investment management fees in the exact manner as would an actual client account. Therefore the performance shown is net of TABR’s investment management fees, and also reflect the deduction of transaction and custodial charges, if any.
Comparison of the TABR Model Portfolios to the Vanguard Total Stock Index Fund, the Vanguard Total International Stock Fund and the Vanguard Total Bond Index Fund is for illustrative purposes only and the volatility of the indices used for comparison may be materially different from the volatility of the TABR Model Portfolios due to varying degrees of diversification and/or other factors.
Past performance of the TABR Model Portfolios may not be indicative of future results and the performance of a specific individual client account may vary substantially from the composite results above in part because client accounts may be allocated among several portfolios. Different types of investments involve varying degrees of risk, and there can be no assurance that any specific investment will be profitable.
The TABR Dividend Strategy presented herein represents back-tested performance results. TABR did not offer the Dividend Strategy as an investment strategy for actual client accounts until September/October 2014. Back-tested performance results are provided solely for informational purposes and are not to be considered investment advice. These figures are hypothetical, prepared with the benefit of hindsight, and have inherent limitations as to their use and relevance. For example, they ignore certain factors such as trade timing, security liquidity, and the fact that economic and market conditions in the future may differ significantly from those in the past. Back-tested performance results reflect prices that are fully adjusted for dividends and other such distributions. The strategy may involve above average portfolio turnover which could negatively impact upon the net after-tax gain experienced by an individual client. Past performance is no indication or guarantee of future results and there can be no assurance the strategy will achieve results similar to those depicted herein.
Inverse ETFs
An investment in an Inverse ETF involves risk, including loss of investment. Inverse ETFs or “short funds” track an index or benchmark and seek to deliver returns that are the opposite of the returns of the index or benchmark. If an index goes up, then the inverse ETF goes down, and vice versa. Inverse ETFs are a means to profit from and hedge exposure to a downward moving market.
Inverse ETF shareholders are subject to the risks stemming from an upward market, as inverse ETFs are designed to benefit from a downward market. Most inverse ETFs reset daily and are designed to achieve their stated objectives on a daily basis. The performance over longer periods of time, including weeks or months, can differ significantly from the underlying benchmark or index. Therefore, inverse ETFs may pose a risk of loss for buy-and-hold investors with intermediate or long-term horizons and significant losses are possible even if the long-term performance of an index or benchmark shows a loss or gain. Inverse ETFs may be less tax-efficient than traditional ETFs because daily resets can cause the inverse ETF to realize significant short-term capital gains that may not be offset by a loss.
For additional information about TABR, including fees and services, send for our disclosure statement as set forth on Form ADV from us using the contact information herein. Please read the disclosure statement carefully before you invest or send money.
A list of all recommendations made by TABR within the immediately preceding one year is available upon request at no charge. The sample client experiences described herein are included for illustrative purposes and there can be no assurance that TABR will be able to achieve similar results in comparable situations. No portion of this writing is to be interpreted as a testimonial or endorsement of TABR’s investment advisory services and it is not known whether the clients referenced approve of TABR or its services.