So Good, It’s Bad, I Can Only Imagine, The Bond Bear, And Augie
In the last two months, the stock market has been sending different messages than what investors were seeing most of 2017. In early February, stocks finished a nearly 11% drop in just 9 trading days. In last month’s update, we presented data which suggested there was likely going to be another leg down, probably to new lows.
Well, that actually happened, but price damage was minimal, and in what normally is an encouraging sign, each decline since early February has come with less selling pressure, which is bullish. This is displayed by examining a couple of market breadth indicators in comparison with price indexes.
A Positive Divergence
Below we show the closing price levels of the New York Composite (NYA) and the S&P 500 Index (SPX) which took place on February 8, along with the subsequent retest of these levels in late March and early April.
| Date | NYA | SPX | New Lows | McClellan Oscillator |
| 2-8 | 12270 | 2581 | 207 | -293 |
| 2-9 | 12405 | 2619 | 356 | -223 |
| 3-23 | 12177 | 2588 | 215 | -196 |
| 4-2 | 12216 | 2581 | 133 | -98 |
You can see that the NYA made a new closing low on March 23, and the SPX matched its low on April 2. But market breadth improved from the readings on New Lows and the McClellan Oscillator which measures advancing and declining stocks. New Lows peaked the morning of February 9, reaching 356, yet dropped to 133 even though the index was lower. A similar pattern took place with the McOsc. Normally, this implies a bullish outcome.
Thus far, prices have held the 200-day moving average lines in the various major indexes, so it is difficult to argue that the “tape” has broken down. But, along the lines of the mixed messages I mentioned above, look at the chart below, courtesy of Doug Ramsey and the crew at the Leuthold Group.
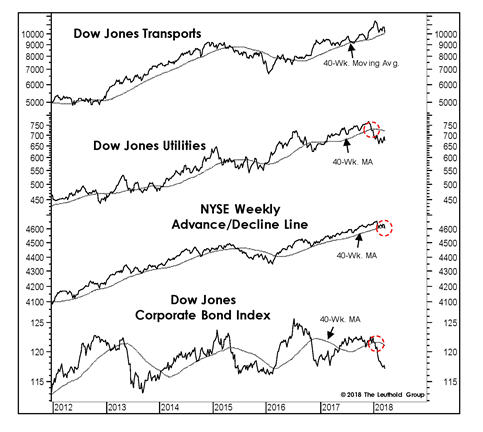
With the exception of the Dow Jones Transportation index, three of these four indicators have fallen below their respective 40-week moving averages. According to Ramsey, since 1941, when these four indicators have been in this configuration (only 11% of the time), the S&P 500 Index has lost -3.3% annualized. So, this is a negative.
So Good, It’s Bad
Though we heavily rely on technical analysis, there is no doubt that fundamentals are important as well. Most of Wall Street focuses on earnings, earnings, and more earnings. In that regard, currently one-year earnings growth is forecasted to be over 18% (see the chart below courtesy of Ned Davis Research).
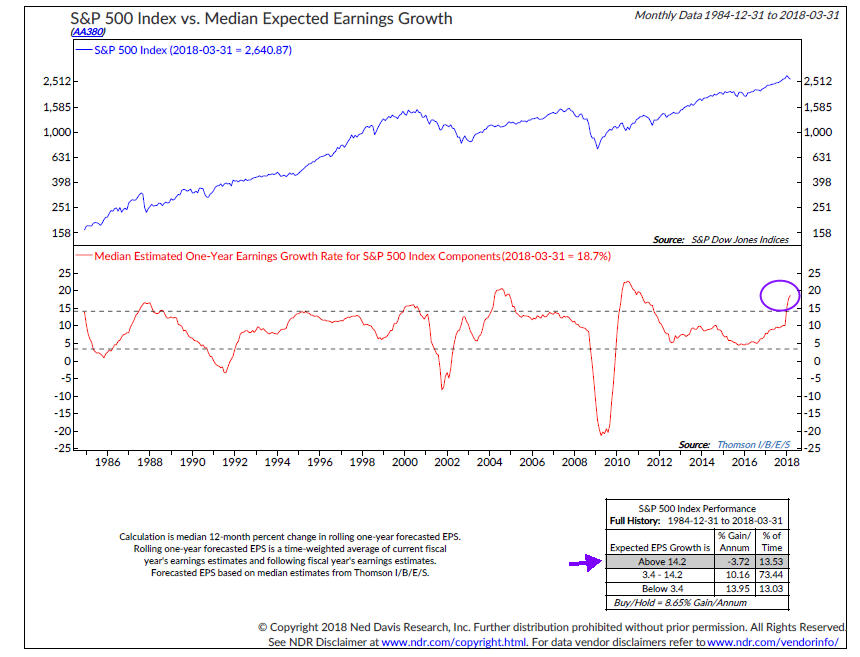
At face value, one would think that is a positive. But, history shows it isn’t. Even President Trump doesn’t understand. In early February, when stocks were declining, he tweeted something like “earnings are up, stock market is down, wrong!”
When earnings are too strong, at some point all the expectations are already priced into stocks, and investors are faced with disappointment. That is where we are currently. As the chart shows, since 1984, in the 13.5% of the time when earnings were expected to grow by 14% or more, the S&P 500 Index actually declined at a -3.7% annualized clip.
This is similar to the record high readings in Consumer Confidence. When there’s too much optimism, at some point there’s nobody left to buy. We’re not necessarily at that point, but as you can see, the market is presenting mixed messages here.
On a bigger picture basis, the chart below of the S&P 500 on a weekly basis gives more perspective (courtesy of www.decisionpoint.com).
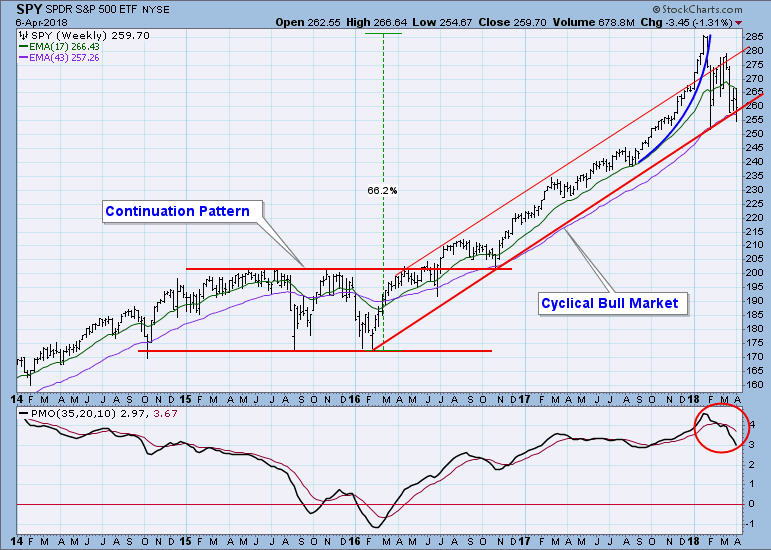
The uptrend line going back to the early 2016 lows is really critical, and currently resides in the 2550 zone on the index. If that line is broken, there is no tangible support until the approximate 2000 level (see the top of the continuation pattern line). That would be about a 30% decline from the January 2018 peak.
I Can Only Imagine
If you’re a movie fan, I’d highly recommend you reserve an evening to go see a great story. I Can Only Imagine, in theaters now, is about the story of the song by the Christian rock group MercyMe, which is the # 1 Christian song of all time. The story is about redemption, love and forgiveness, and I was blown away by it.
This month, I thought I’d use the title of that song as a reminder that the stock market is not for the faint of heart. Periodically, there are severe declines. And, markets don’t always recover quickly. Sometimes, like in Japan, they don’t recover at all. This is especially important to those in, or close, to retirement. Below is a chart of the historical drawdowns of the S&P 500 Index, going back to 1955. The chart, and data, are courtesy of Jim Picerno and Yahoo Finance.
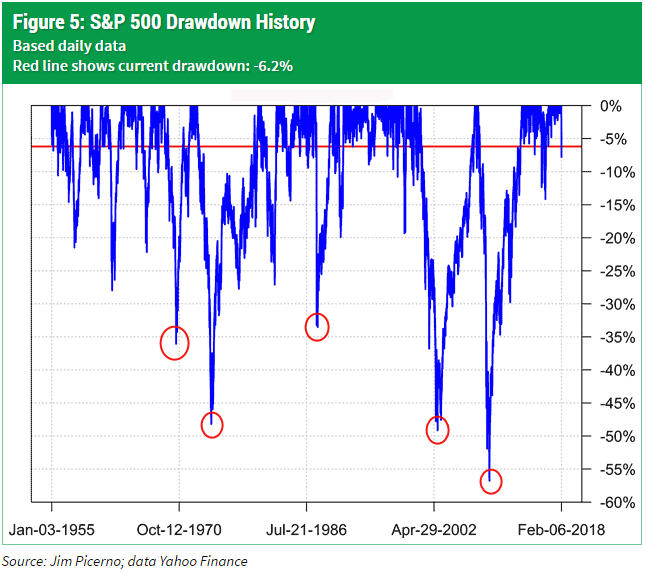
We’ve circled 5 instances since 1970 where the declines have been 30% or greater. That is one about every 9.6 years. The last one was in 2008. You do the math. Nothing guarantees it will happen, but stocks are due for a big decline, and that is supported by excessive valuations.
We don’t fear this process, or the outcome. It is why we at TABR strongly favor a tactical approach which focuses on risk management. The clients we tend to attract don’t have the time, nor the temperament, to buy and hold, and wait for the market to recover from a significant drop. For those investors who are heavily invested in stocks, I’d suggest you’d better ask yourself this question right now—can you hold onto your portfolio if stocks go down 50% or more? If you can’t, you’d better make some changes pretty quick, or be prepared to live with the consequences.
I don’t say that because I know it’s going to happen. I say that because I know it can.
Where We Stand
Since our early March update, our risk models for the stock market have deteriorated further, with 4 of 8 now positive. As a result, our tactical equity allocations are at 50%, with 50% in cash. TABR’s Dividend Stock strategy is 55% invested, with 45% in cash. We expect to reduce exposure further within the next month, as seasonal considerations begin to turn negative.
On the bond side, our risk model for High Yield bonds remains on its February 12 SELL signal. So far, this part of the bond market has not declined, but rather has edged higher by about 0.75%.
Overall, we are in a defensive position in bonds, and are rather neutral on stocks. It is still possible that stocks could rally back and make new highs. It is also possible they will fail, and finally take out the February lows shown above and break down in a big way. We don’t know which is going to happen. We’d certainly prefer new highs, since we’d make some money, but know we would lag quite a bit holding cash. But, that is part of our discipline and process. Our risk models are not always right. We don’t always buy back lower. But they are designed to be right when we NEED them to be right.
It’s like buying car insurance. You might pay $1500 a year to insure your Lexus, and you’re not going to get a refund at the end of each year simply because you didn’t get in any accidents or have any claims. There is a reason we carry the insurance. It is to protect against catastrophic risk.
The Bond Bear
Though many may not realize it, since July 2016, the bond market has been in a bear market (when prices are mostly declining). That is because in that period, the yield on the 10-year Treasury Note has more than doubled, from 1.36% on July 8, 2016 to its most recent peak at 2.94% on February 21. The yield currently sits at 2.83%. But, not all types of bonds behave the same way.
Below is an updated chart of the yield on the 10-year note, which we last featured in October 2017. The chart is courtesy of Ned Davis Research.
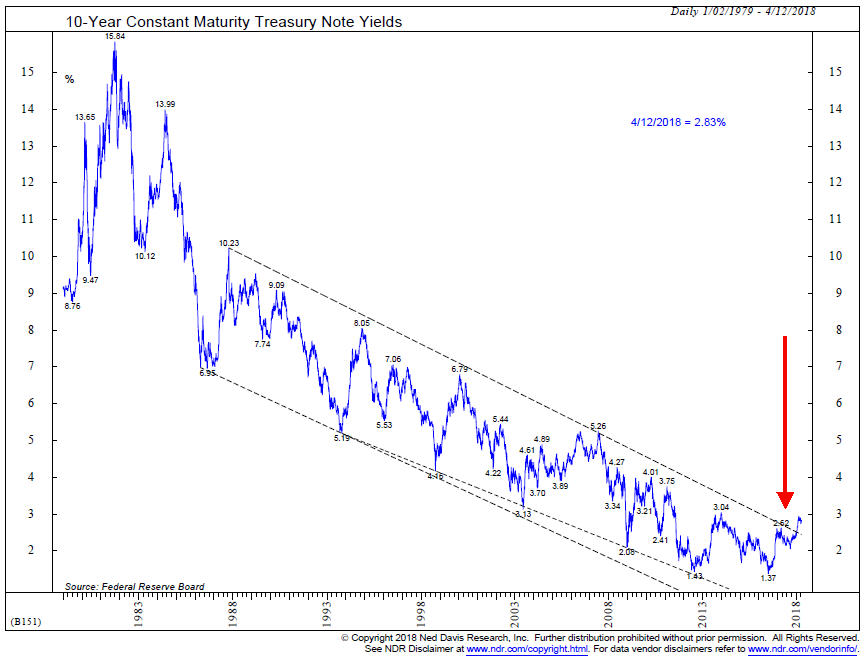
We’ve pretty much broken the downtrend line which can be traced back to about 1980. But, yields have not pierced (yet) the magical 3% level. A number of analysts think that is only a matter of time. The Federal Reserve Board is in a tightening mode, and expects to continually increase the Fed Funds rate later this year and supposedly into 2020. This rate has gone from 0% to 1.50% since December 2015 and is expected to go to at least 2% by the end of this year.
We certainly know that supply is increasing significantly. Every quarter, the Fed is shedding $30 billion per month from their portfolio, which will peak at $50 billion per month starting this October. In addition, the federal deficit is expected to top $1 trillion this year. So, if all these bonds are coming to market, isn’t it a fait accompli that interest rates must go up? That depends on demand. If there is not enough demand at current rates, then, yes, rates WILL go up. How much, no one knows. I can tell you this, though. With overall debt at $4 trillion, a 1% increase in rates will increase interest payments by $400 billion.
If stocks have soared since 2009 because of QE (quantitative easing), then it is mathematically precise that stocks must decline because of QT (quantitative tightening). By how much? I can only imagine.
Below is a summary of how various bond funds have performed during this period of rising yields. Several of the funds are part of TABR’s bond strategies, and we’ve included the results of TABR’s all-bond account for comparative purposes.
| Fund | Duration | Yield | Drawdown |
| TLT 20 yr Treasury Bond ETF | 17.55 yrs | 2.87% | -15.46% |
| Franklin California Tax Free Fund | 6.60 | 3.63 | -2.18% |
| Vanguard Total Bond Index Fund | 6.14 | 2.85 | -2.84% |
| Powershares Bullet Share 2024 Fund BSCO | 5.34 | 3.51 | -0.27% |
| Sierra Strategic Income Fund SSIRX | 4.68 | 3.33 | +5.27% |
| Blackrock High Yield BRHYX | 3.68 | 5.76 | +14.61% |
| PIMCO Income Fund PIMIX | 2.39 | 5.45 | +10.52% |
| Fidelity Short Term Bond Fund FSHBX | 1.72 | 2.26 | +0.30% |
| PIMCO Short Term Fund PTSHX | 0 | 2.16 | +4.18% |
| TABR All Bond Account | n/a | n/a | +5.60% |
You can see that unless one is invested in longer duration bonds, a bond bear market doesn’t have to be a terrible thing. Virtually all the strategies we use in TABR’s bond account had positive results, ranging from high yield to PIMCO Income and Sierra Strategic. That won’t always happen, but it’s a reminder why we so much believe in being tactical.
Where will interest rates go from here? We have no idea, even though the supply side suggests the path will be up. Most importantly, we just follow our process, which has been able to handle most environments quite well.
Augie
On March 15, the world of college baseball lost the greatest coach to ever work in the game, Augie Garrido. At age 79, he passed away in Newport Beach after a severe stroke just a few days prior.
Coach Garrido won five national championships during his career, three at Cal State Fullerton and two at the University of Texas, and is the winningest coach in college baseball history. I was privileged to be one of over 1000 young men to either play or work for Augie during his career. My adventure with Cal State Fullerton, which is still going on, started in 1977 when I wrote Augie a letter and told him of my interest in attending Fullerton and becoming his baseball intern. And, that’s exactly what happened.
I was part of the team for the 1978 season, but had to leave my position in early April to join the Angels in their public relations department, which was my ultimate dream. One year later, in 1979, the Titans won their first national championship, and were on their way to becoming a national baseball power, which they still are today, having reached the College World Series in two of the past three years.
Though I was only around Augie consistently for the better part of one year, his influence on me has lasted a lifetime. He was the best coach I’ve ever been around, and was an amazing teacher. It wasn’t until I was older that I began to realize how special he was at what he did—the talks in the dugout and the locker room were just legendary. Though outsiders might think Augie just taught baseball, what he really taught all of us who were lucky enough to play for him or work with him, was about life. The lessons he emphasized about adversity and being part of a team were all about learning how to successfully navigate life.
We never lost touch over the 40 years I knew Augie. Though he spent the last 20 years employed at Texas (retiring from coaching two years ago), he and wife Jeannie always maintained a place in Newport and would typically be in the area from mid-November to early January, returning to Texas for the start of the college baseball season. For about the past 10 years at least, he and I would have a ritual usually in December to meet up for lunch, almost always at Zov’s Bistro in Tustin, where we would typically feast on some lamb or other delicious Armenian dishes. Augie loved food, was immensely interested in the kitchen, and had his own cooking show back in Texas on the Longhorn Sports Network.
I didn’t know it at the time, but our last lunch was in late December. And though I went to see him in the hospital knowing his condition was quite serious, he probably couldn’t hear me then when I held his hand and talked to him. But, whenever we would part at the end of lunches, I would always give him a hug, and say, “Augie, thank you for all you’ve done for me. I love you.”
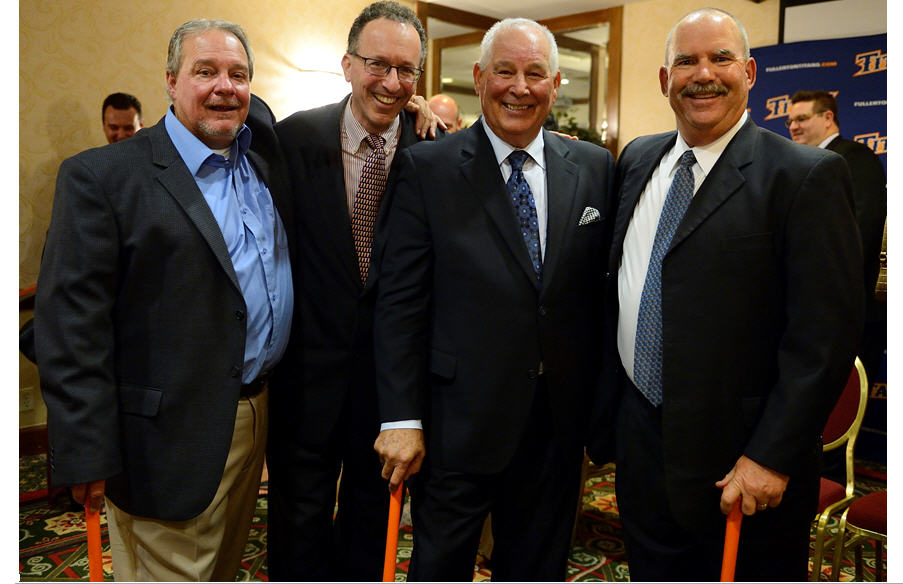
I’ve been so lucky to have been touched by him. Below is a photo with me next to Augie, with Coach Rick Vanderhook on the left (the current Fullerton coach), and Coach George Horton on the right (the current Oregon coach). Before Augie left to take the Texas job in 1997, Rick and George were his assistant coaches at Fullerton, and George succeeded him at Fullerton before leaving to take the Oregon job.
Material Of A Less Serious Nature
One day, an old man, his mule and his dog were walking down the road. A truck came around a curve, out of control, and hit all three of them, where they ended up in a ditch.
The old man sued the driver for damages, and months later, in court, the defense attorney said to the old man, “On the day of the alleged incident, did you not say to my client, “I’ve never felt better in my life?”
The old man said, “My dog, my mule. . .
“No, answer the question,” said the attorney. The old man replied again, “My dog, my mule. . . . “No, I said please answer the question,” said the defense attorney.
For the third time, the old man began to talk, and finally, the attorney said to the judge, “Please direct the witness to answer the question.”
The judge replied, “No, I want to hear what he has to say.”
So, the old man started. “We were walking down the road, my mule and my dog, when around the curve came this out of control truck, which hit all three of us, and we ended up in the ditch. I was pretty shaken up, and when I looked up, the driver of the truck had come over, cocked his shotgun, and killed my dog. Then, he noticed my mule had a broken leg, and he shot him too. Finally, he re-loaded, pointed the gun at me and said, “Are you OK?” And then I answered, “I’ve never felt better in my life.
Thanks for getting this far. We so much appreciate your continued trust and confidence in all of us at TABR. The Angels are off to their best start in club history, my Titans have won 6 in a row, and the Ducks started the Stanley Cup Playoffs last night against San Jose (but my Stars collapsed!). A mostly happy April beginning.
Sincerely,

Bob Kargenian, CMT
President
TABR Capital Management, LLC (“TABR”) is an SEC registered investment advisor with its principal place of business in the state of California. TABR and its representatives are in compliance with the current notice filing and registration requirements imposed upon registered investment advisors by those states in which TABR maintains clients. TABR may only transact business in those states in which it is notice filed, or qualifies for an exemption or exclusion from notice filing requirements.
This newsletter is limited to the dissemination of general information pertaining to our investment advisory/management services. Any subsequent, direct communication by TABR with a prospective client shall be conducted by a representative that is either registered or qualifies for an exemption or exclusion from registration in the state where the prospective client resides. For information pertaining to the registration status of TABR, please contact TABR or refer to the Investment Advisor Disclosure web site (www.adviserinfo.sec.gov).
The TABR Model Portfolios are allocated in a range of investments according to TABR’s proprietary investment strategies. TABR’s proprietary investment strategies are allocated amongst individual stocks, bonds, mutual funds, ETFs and other instruments with a view towards income and/or capital appreciation depending on the specific allocation employed by each Model Portfolio. TABR tracks the performance of each Model Portfolio in an actual account that is charged TABR’s investment management fees in the exact manner as would an actual client account. Therefore the performance shown is net of TABR’s investment management fees, and also reflect the deduction of transaction and custodial charges, if any.
Comparison of the TABR Model Portfolios to the Vanguard Total Stock Index Fund, the Vanguard Total International Stock Fund and the Vanguard Total Bond Index Fund is for illustrative purposes only and the volatility of the indices used for comparison may be materially different from the volatility of the TABR Model Portfolios due to varying degrees of diversification and/or other factors.
Past performance of the TABR Model Portfolios may not be indicative of future results and the performance of a specific individual client account may vary substantially from the composite results above in part because client accounts may be allocated among several portfolios. Different types of investments involve varying degrees of risk, and there can be no assurance that any specific investment will be profitable.
The TABR Dividend Strategy presented herein represents back-tested performance results. TABR did not offer the Dividend Strategy as an investment strategy for actual client accounts until September/October 2014. Back-tested performance results are provided solely for informational purposes and are not to be considered investment advice. These figures are hypothetical, prepared with the benefit of hindsight, and have inherent limitations as to their use and relevance. For example, they ignore certain factors such as trade timing, security liquidity, and the fact that economic and market conditions in the future may differ significantly from those in the past. Back-tested performance results reflect prices that are fully adjusted for dividends and other such distributions. The strategy may involve above average portfolio turnover which could negatively impact upon the net after-tax gain experienced by an individual client. Past performance is no indication or guarantee of future results and there can be no assurance the strategy will achieve results similar to those depicted herein.
Inverse ETFs
An investment in an Inverse ETF involves risk, including loss of investment. Inverse ETFs or “short funds” track an index or benchmark and seek to deliver returns that are the opposite of the returns of the index or benchmark. If an index goes up, then the inverse ETF goes down, and vice versa. Inverse ETFs are a means to profit from and hedge exposure to a downward moving market.
Inverse ETF shareholders are subject to the risks stemming from an upward market, as inverse ETFs are designed to benefit from a downward market. Most inverse ETFs reset daily and are designed to achieve their stated objectives on a daily basis. The performance over longer periods of time, including weeks or months, can differ significantly from the underlying benchmark or index. Therefore, inverse ETFs may pose a risk of loss for buy-and-hold investors with intermediate or long-term horizons and significant losses are possible even if the long-term performance of an index or benchmark shows a loss or gain. Inverse ETFs may be less tax-efficient than traditional ETFs because daily resets can cause the inverse ETF to realize significant short-term capital gains that may not be offset by a loss.
For additional information about TABR, including fees and services, send for our disclosure statement as set forth on Form ADV from us using the contact information herein. Please read the disclosure statement carefully before you invest or send money.
A list of all recommendations made by TABR within the immediately preceding one year is available upon request at no charge. The sample client experiences described herein are included for illustrative purposes and there can be no assurance that TABR will be able to achieve similar results in comparable situations. No portion of this writing is to be interpreted as a testimonial or endorsement of TABR’s investment advisory services and it is not known whether the clients referenced approve of TABR or its services.