Talk Purdy To Me
Eventually, I’ll get into our recap of 2023 and how current market conditions look, but that’s all taking a back seat in my head through this Sunday night, when at about 8 pm Pacific time, either the 49ers or the Chiefs will be Super Bowl champions. Since by some in the media this has become known as the “Taylor Bowl,” as in Taylor Swift, I thought I would lay out for you what’s going to happen. It helps to have a voluminous song catalog, so read on.
The Super Bowl
If I have my way, it’s simply Karma that the Niners win. Jim Harbaugh restored greatness to the franchise back in 2012, but could never quite win the Super Bowl. He went to Michigan, and struggled for six years, until figuring it out, and winning the national championship this year. Now, he’s the Chargers head coach. Watch out. Kyle Shanahan has taken the 49ers to the NFC Championship Game in 3 of the past 4 years, and the Super Bowl twice in the last four years. His Atlanta Falcons blew a 28-6 lead over the Patriots a few years back in the Super Bowl, and these same 49ers blew a 10-point lead to the Chiefs in the Super Bowl just 4 years ago. It’s his time, now. He has a quarterback that was drafted with the last pick of the last round, who’s playing better than virtually every quarterback in the NFL not named Mahomes. His name is Brock Purdy, and many members of the media think he’s a “game manager.” All I have to say is “the haters gonna hate, hate, hate, hate, hate.”
By the way, Brock is a devoted Christian who credits Jesus for everything he does, and gives him the ability to have peace and steadfastness among the chaos. In My Wildest Dreams, I couldn’t imagine a more deserving young man and fitting victory for the 49ers. I know. I know. Travis Kelce is a good guy. He’s “The Man.” But when Taylor’s father asked her about Brock, she replied, “But Daddy, I Love Him.” “He Talks Purdy To Me.” If I have my way, at about 8 pm Pacific time, Sunday evening, Chiefs fans will be asking “Is It Over Now?” No worries. You’ll “Shake It Off,” and “Soon, You’ll Get Better.” And Patrick and Company will be saying, “Would’ve, Could’ve, Should’ve.”
And finally, God, if you don’t answer this prayer for a 49ers victory, you’ll just be downright “Mean.”
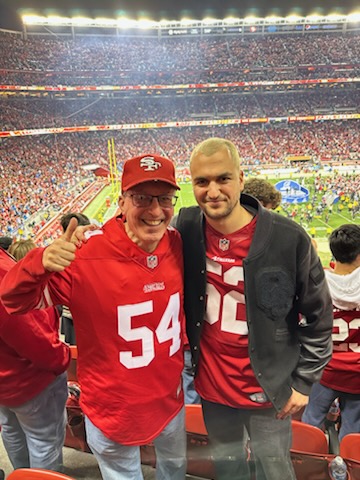
Above, son Adam and I celebrating at Levi’s Stadium after the 49ers came back from a 17-point deficit against Detroit to advance to the Super Bowl. As Jim Harbaugh says, “Who has it better than us?” “NOBODY!” It will be even better if the 49ers can win the Super Bowl. And, no, we’ll not be at the Super Bowl. Unless we win the Power Ball this week. Blowing $25,000 on a football game (not having access to tickets at face value) just doesn’t make common sense with my value system.
By the way, we use momentum (relative strength) as one of the primary technical tools in our selection process for both ETFs and individual stocks. For those of you into sports like I am, you better believe there’s such a thing as momentum in sports. It happened in the 49ers game vs Detroit, starting in the third quarter, with SF trailing by 14 points. The Lions had a 4th and 2 at the SF 28 yard line, and instead of kicking a field goal, Detroit’s coach decided to go for it. The Niners defense stopped them, then threw a 50-yard bomb that turned into a miracle catch, scored a TD, then forced a fumble on the first play of the next possession, and within about 4 minutes, had scored 14 points and tied the game, and the stadium was going absolutely bonkers. That carried through the fourth quarter, and SF is in the Super Bowl.
This is why people go to sporting events. It’s unscripted. Unexpected. Unexplainable. Unmeasurable. Because of what was on the line, this was easily one of the two greatest sporting events I’ve ever been to. The other is below. Game Six of the World Series, Angels vs Giants.
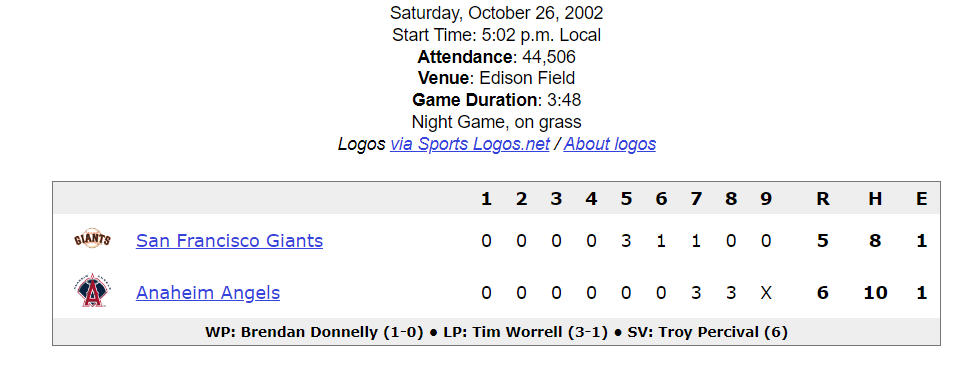
In similar fashion, the Angels were losing 5-0 in the bottom of the 7th inning, with the Giants leading 3 games to 2 in the Series. The place was dead. Until it wasn’t, when Scott Spiezio hit a dramatic 3-run homer and all of a sudden, everything changed. Momentum. It carried over to the 8th inning, and the rest is history. Granted, the Angels still had to win Game 7, but it’s almost as if after the Giants blew the game, the result was baked in the cake. Us Angels fans better savor that victory, because it will never happen again as long as Arte Moreno is the owner of the team. In sports, momentum is a force that you can’t see, you can’t measure, but boy oh boy, you sure can feel. Here’s hoping Momentum is with the 49ers all 60 minutes on Sunday.
The State Of Markets And Some Perspective
Stock markets ended 2023 on a strong note the last two months, and that has carried over into early 2024. Since late November to early December, our stock exposure in tactical accounts increased from 67% to 83%, where it remains today, and our high yield bond fund risk model remains on its November 3 BUY signal. Of our stock market risk models, 5 of the 6 are on BUY signals. All in all, this is a positive environment at present, but it would not be surprising to see some consolidation at a minimum, soon. The advance year-to-date, with the S&P 500 trying to close above the 5000 level for the first time, has been concentrated in large companies, and breadth divergences are beginning to pop up.
For example, through February 8, the S&P 500 Index was up 4.84% for the year, and the QQQ (Nasdaq 100) an even greater 5.68%. These indexes are dominated by the 10 largest companies, which include Microsoft, Nvidia, Apple, Amazon, Meta and others. In contrast to the above, the S&P 400 Midcap Index is up just 0.34%, the S&P 600 Smallcap Index is down -3.25% and the Vanguard Total International Stock Index is also down -1.12%.
Though some major indexes are making new highs, the number of stocks participating in the advance is shrinking. It’s not broad-based. Below is a chart of the NY Composite and the number of stocks making new 52-week highs. This is courtesy of www.decisionpoint.com.
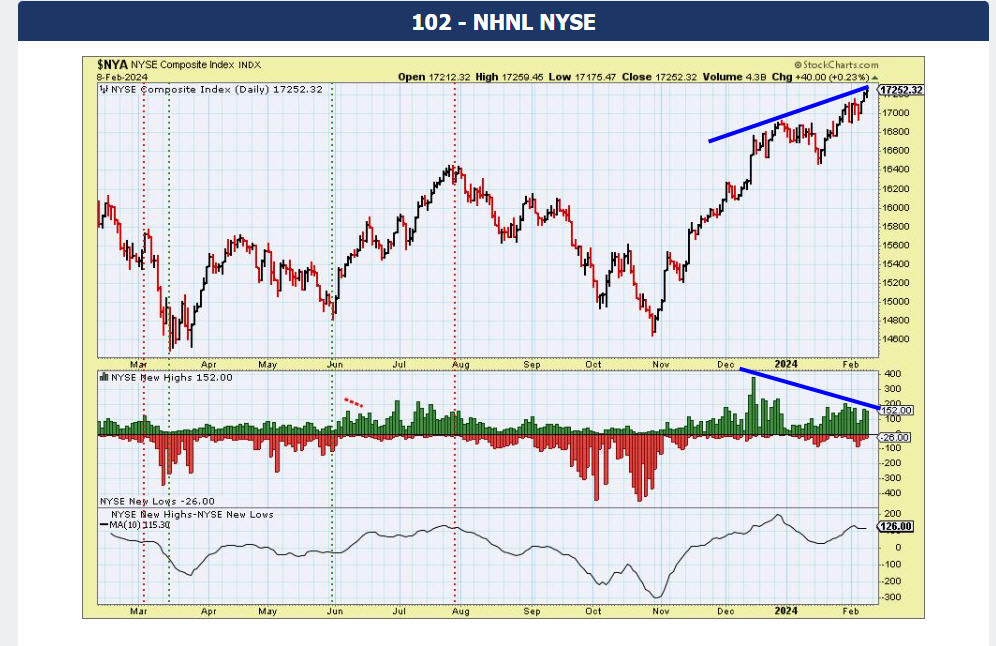
Since mid-December when the index broke out, new highs peaked at nearly 400, but have since receded to just over 150, even as the index has continued higher, now nearly 3% above the mid-December levels. Fewer and fewer stocks are participating in the rally, which is not healthy. By the way, the gap in performance between large and small stocks for the start of this year is one of the largest on record. This is a good example of where relative strength trends are, and how they fit into our investment process. We’ve not owned small caps in our tactical accounts for a while, simply because they have not been leading the market (nor for that matter have international stocks). Below is a longer term look at the trends in large vs small stocks.
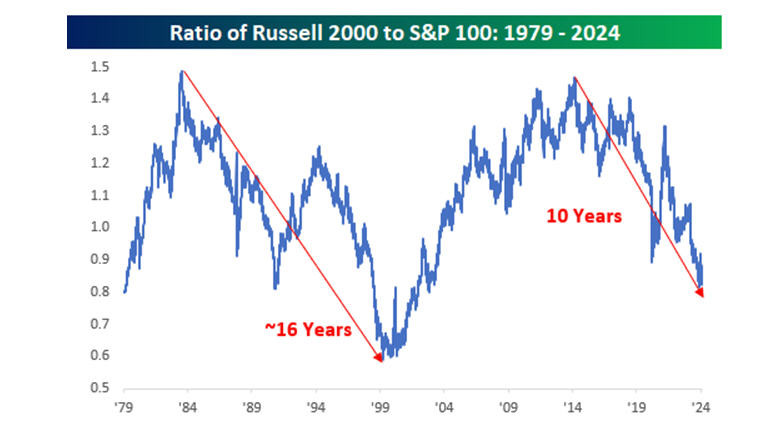
The graph above depicts the ratio of the Russell 2000 Index (small caps) to the Russell 1000 Index (large caps), going back to 1979. The chart is courtesy of www.bespokeinvest.com. After bottoming in late 1999, small caps outperformed for nearly 14 years, but are now at their lowest level relative to large caps in 10 years. How long can this go on? Who knows. We don’t try to guess those things. We use the data to tell us what is going on. The dominance of large companies feels like it could go on forever. Just own Apple, Microsoft, Amazon, Nvidia, Meta, Google and a few others. However, it’s important to maintain perspective. Those companies cannot grow at their past growth rates forever. Though they may not be as expensive as large caps were in 1999, that’s about the only time in history valuations have been higher than today.
And though it may be a low probability, it’s a good reminder to look at the chart below, and see what happened to the iShares S&P 500 Growth Fund from May of 2000 to May of 2009. The chart below is courtesy of www.stockcharts.com.
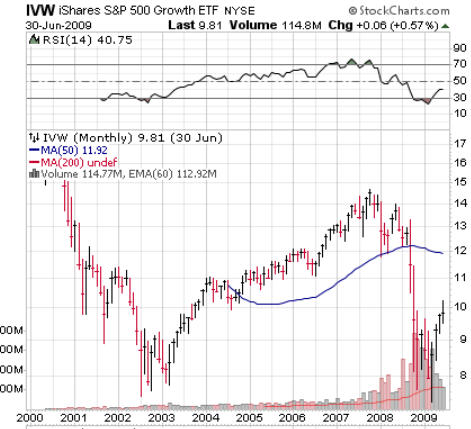
From May 26, 2000, which was the inception of this ETF, to May 26, 2009, the ETF had a return (including dividends), of -35.46%. Had I stopped the analysis on March 9, 2009, which was the bottom of that bear market, the losses were -50.46%. I’m not saying this is going to happen again. I am saying it COULD happen again. As a side note, since July 3 of last year, solely due to our relative strength process, all of our tactical stock market exposure has been in large stocks, owning the IVW (the same fund as above), the OEF (the S&P 100) and the QQQ (the Nasdaq 100). We are in the right place at present. The difference is, we won’t be owning these indexes forever. When they lose their momentum and begin to fall out of the top portion of our ranking process, we’ll be rid of them. And who knows, maybe someday small caps will be at the top.
Election Year Cycles And What To Expect
Since 1952, there have been 18 election years. Caveat. This is not statistically significant when looking at the data below. In January of this year, the S&P 500 gained +1.58%. As the table below shows, which is courtesy of the StockTradersAlmanac.com and systematicindividualinvestor.com, there have been 9 January’s where the S&P 500 closed negative for the month. In three of the 9 cases, stocks posted negative returns for the year, with an average loss of (-1.1%). In the nine prior cases where stocks were positive in January, stocks posted gains each time, with the smallest gain being +9% and the average gain +15.6%.
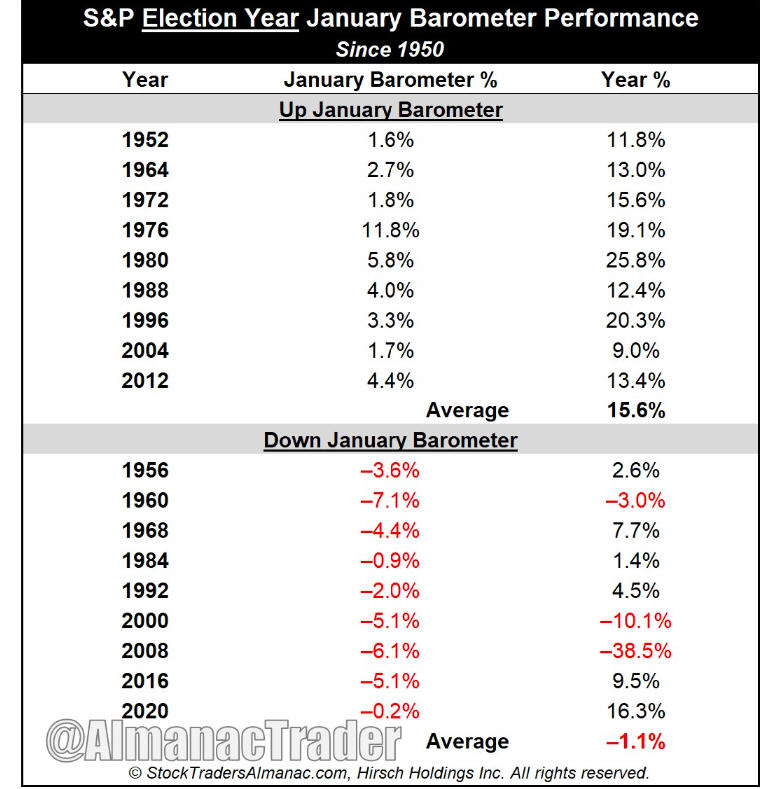
This development would seem to bode well for the remainder of 2024. Finally, below is a chart that synthesizes every election year since 1950 together, courtesy of All Star Charts.
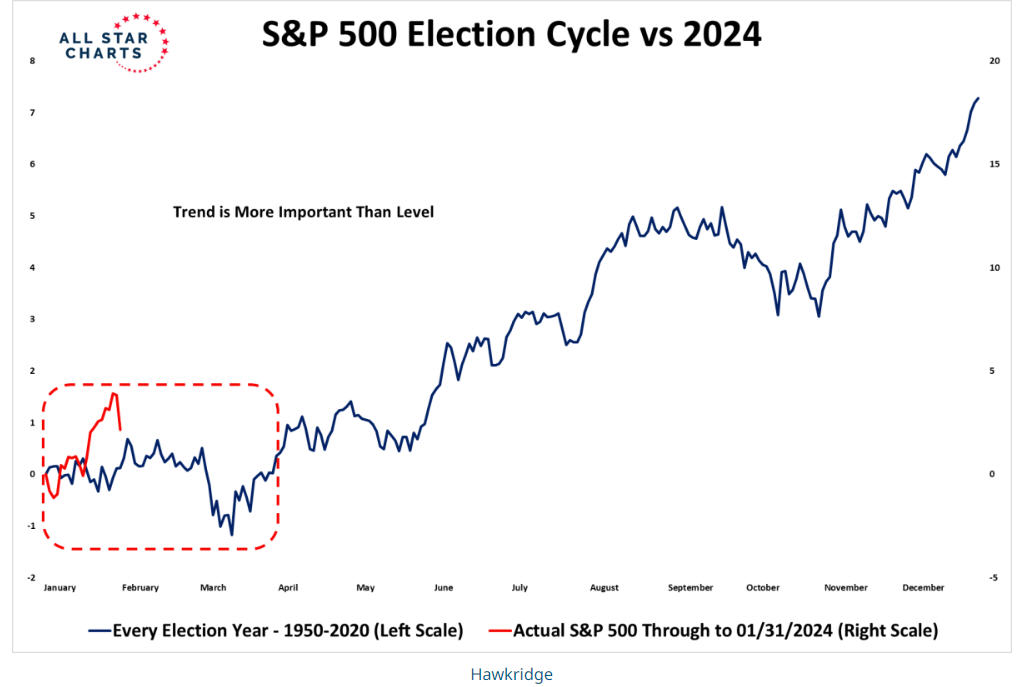
If only it was as easy as the chart looks. A pretty much sideways market into mid-year. A rally into the fall, with a drop into the Election, and a rally to close the year. We’ve talked about forecasts in the past, and will no doubt talk about them in the future. Pick your bias. Nobody, and no method is consistently correct. We’ll adjust to how the market is acting, day to day and week to week. One of the hottest analysts we follow, Tom Bowley of www.EarningsBeats.com, is calling for new highs and an 11% gain in the S&P 500. Since I learned about Tom, he’s correctly called the 2022 bear market and last year, in January, he thought the market would close the year at new highs. In essence, he was right on. At some point, he’ll be wrong. Another analyst we respect, Walter Murphy, uses a different approach, and thinks stocks will peak sometime in the first half of the year, and eventually re-visit the 3600 level on the S&P 500. They couldn’t be more opposite. What I’ve learned in doing this for 40 years is this—optimists make more money in the stock market than pessimists do. . .but one cannot afford to be a constant Pollyanna.
A Look Back At 2023
We’ve always found it useful to look backwards and contemplate what we’ve done. This can be helpful even when things seem to be going right, but even more so when they’re not. It’s how one can make course corrections, and fix things.
Transparency has been a fixture at TABR since we were founded in 2004. The vast majority of RIAs in our business do not publish a track record. They may cite compliance issues, or the work necessary to comply with regulations, or that all their clients have “customized” portfolios. Simply put, we do publish one, because we believe in our process, and our staff backs that up by investing the vast majority of their personal savings in the exact same strategies we use for clients.
Sometimes, the numbers aren’t pretty, and other times, they are great. That is part of being in investment management. Even the best money managers in the business go through years of underperformance. We are no different. The key is, in our view, sticking with your discipline, but also having the courage to fix things when something may be amiss.
And though below you will see comparisons to industry benchmarks, ultimately we are judged by helping our clients achieve their goals, with substantially less risk than passive, buy and hold strategies. Besides our combined 60 years of financial planning and investment management wisdom, that is probably the one big difference and edge we have over competitors. I should note that we do have buy and hold, fully invested strategies, as they serve as diversification with our main approach, and can appeal to some clients who want to be more aggressive with a part of their capital. All of those results are included below.
The vast majority of our stock market risk models are trend-following. That was a tremendous edge in 2022, and a big albatross in 2023. Our portfolios had a substantial relative and absolute performance edge in 2022, preserving capital in the bear market, and subsequently lagged by similar amounts to the upside in 2023. Whatever trends emerged, they didn’t last, and this wreaked havoc with our equity models. Example. We entered the year 40% invested with our tactical equity exposure. By February 2, we were 100% invested. By March 27, we were back down to 20%. Then, by May 1, back to 100%. From August 30 to November 8, we went from 80% invested to 17%, and back to 83% by December 11. That’s called getting whipsawed. It is the weakness with trend following. Nothing works all the time.
Here’s the high level summary. For the year, the Vanguard Total Bond Index Fund gained 5.60%. This fund makes up 45% of our Moderate Allocation benchmark. The Vanguard Total International Stock Fund gained 15.44%, and this fund makes up 13.75% of the benchmark. The Vanguard Total Stock Market Index Fund gained 25.89%, and it makes up 41.25% of the benchmark. Though similar, but not exactly, the Vanguard S&P 500 Index Fund gained 26.11% for the year. All of our tactical strategies lagged badly, as noted above, yet as pointed out in our November 2023 Monthly update, for the two years ended in 2023, our tactical strategies essentially matched their fully invested benchmarks for the period, yet with much lower maximum drawdowns. That’s because of the power of compounding. When you lose a lot more, it takes a lot more to get back to even.
In addition, our performance in tactical accounts was hurt by our sector rotation strategy, which absolutely shined in 2022, losing just over -4% that year due to being in energy related funds. Well, as good as it was in 2022, it was bad in 2023, gaining about 3.6% in 2023, assuming one owned the top four sector funds within our process and rebalanced monthly (which we don’t do, due to turnover issues). Again, nothing works great every year, and one must have the discipline to stick with things that have worked over time. As we entered 2024, we have tweaked our 20% floor exposure to where we now own only 3 sector funds instead of 4 as in the past, increasing the weight to our style box allocation to hopefully smooth our performance out over time.
We can safely say that our relative strength process, or what we own, was not the problem in 2023. Had we been fully invested in our top 3 funds each month, and rebalanced equally, the approximate gain would have been around +23.24%, right in line with the fully invested S&P 500 Index. In essence, risk management harmed us in 2023, but since that is one of the most important things to many, if not most of our clients, it’s not something we’ll be abandoning any time soon. On the bright side, and the aggressive side, our fully invested stock strategy, which has been using the S&P 100 universe for selections, gained over 25% for the year, and since its inception in February of 2020, has compounded at over 16% annually for the nearly four years of its existence. We’re now running a second version which uses the S&P 500 universe, and may be merging them together at some point.
Below is the performance, net of management fees, of TABR’s six different portfolios at present. These represent a majority of the strategies we are using in client accounts, but not all. The differences are mainly attributed to risk (example–moderate allocation versus conservative allocation or aggressive) and account size. The numbers are for the time periods of the past year, the past 5 years and 10 years (if applicable) in accordance with SEC performance reporting requirements. We’ve also provided appropriate benchmarks for each strategy.
| Type Of Account/Strategy | 2023 Return | 5 Years Ended 2023 (or since inception) | 10 Years Ended 2023 (or since inception) |
| TABR Tactical Moderate | 4.46% | 3.81% | 2.72% |
| Moderate Benchmark (40/15/45)* | 15.19% | 7.70% | 6.10% |
| TABR Tactical Conservative | 3.77% | 3.09% | 2.23% |
| Conservative Benchmark (30/10/60)** | 12.67% | 6.00% | 5.00% |
| TABR Bond Account | 3.64% | 1.68% | 2.01% |
| Bond Benchmark (Vanguard Total Bond VBMFX) | 5.60% | 1.00% | 1.60% |
| TABR Passive Index Mix (Moderate) | 12.54% | 6.77% | 5.76%(since 12-31-15) |
| TABR Tactical Stock (100% stock/tactical) | 6.27% | 6.24% | n/a |
| Tactical Benchmark (75/25)*** | 23.27% | 13.10% | n/a |
| TABR Relative Strength OEX S&P 100 | 25.43% | 16.70% (since 2-24-20) | n/a |
| Relative Strength Benchmark (VFINX 500) | 26.11% | 12.3% (since 2-24-20) | n/a |
| Vanguard Total Stock Market Index (VTSMX) | 25.89% | 15.10% | 11.4% |
| Vanguard Total International Stock Index (VGTSX) | 15.44% | 7.30% | 4.0% |
Note–all returns cited include reinvested dividends.
*consists of 45% Vanguard Total Bond, 41.25% Vanguard Total Stock and 13.75% Vanguard Total International Stock
**consists of 60% Vanguard Total Bond, 30% Vanguard Total Stock and 10% Vanguard Total International Stock
***consists of 75% Vanguard Total Stock and 25% Vanguard Total International Stock
Material Of A Less Serious Nature
A sixty-five-year-old man is sitting, drinking at the bar when he sees the most gorgeous, 25-year-old girl walk in. She’s so beautiful, that he can’t stop staring at her. He just can’t take his eyes off her. She notices him looking, and as he is about to apologize for staring, she cuts him off and says, “I will do anything you like. Anything at all. Anything that your mind can think of. Nothing is too crazy or extreme for me. I will do it. No questions asked.
“I will do this for $100 and one other condition.”
Stunned by the turn of events, the man says, “What’s the other condition?”
She replies, “You have to ask me using only three words.”
He thinks about this for a while and pulls out his money and gives her ten $10 bills, and puts it in her outstretched hand.
He then looked her deep in the eyes and said to her, “Paint my house.”
What a deal. Here’s hoping you have a happy, prosperous and healthy 2024. Thank you for allowing us to serve you, and for the trust and confidence you place in all of us at TABR.
And remember. . . .there’s nothin’ finer than a 49er!
Sincerely,
Bob Kargenian, CMT
President
TABR Capital Management
TABR Capital Management, LLC (“TABR”) is an SEC registered investment advisor with its principal place of business in the state of California. TABR and its representatives are in compliance with the current notice filing and registration requirements imposed upon registered investment advisors by those states in which TABR maintains clients. TABR may only transact business in those states in which it is notice filed, or qualifies for an exemption or exclusion from notice filing requirements.
This newsletter is limited to the dissemination of general information pertaining to our investment advisory/management services. Any subsequent, direct communication by TABR with a prospective client shall be conducted by a representative that is either registered or qualifies for an exemption or exclusion from registration in the state where the prospective client resides. For information pertaining to the registration status of TABR, please contact TABR or refer to the Investment Advisor Disclosure web site (www.adviserinfo.sec.gov).
The TABR Model Portfolios are allocated in a range of investments according to TABR’s proprietary investment strategies. TABR’s proprietary investment strategies are allocated amongst individual stocks, bonds, mutual funds, ETFs and other instruments with a view towards income and/or capital appreciation depending on the specific allocation employed by each Model Portfolio. TABR tracks the performance of each Model Portfolio in an actual account that is charged TABR’s investment management fees in the exact manner as would an actual client account. Therefore the performance shown is net of TABR’s investment management fees, and also reflect the deduction of transaction and custodial charges, if any.
Comparison of the TABR Model Portfolios to the Vanguard Total Stock Index Fund, the Vanguard Total International Stock Fund, the Vanguard Total Bond Index Fund and the S&P 500 Index is for illustrative purposes only and the volatility of the indices used for comparison may be materially different from the volatility of the TABR Model Portfolios due to varying degrees of diversification and/or other factors.
Past performance of the TABR Model Portfolios may not be indicative of future results and the performance of a specific individual client account may vary substantially from the composite results above in part because client accounts may be allocated among several portfolios. Different types of investments involve varying degrees of risk, and there can be no assurance that any specific investment will be profitable
For additional information about TABR, including fees and services, send for our disclosure statement as set forth on Form ADV from us using the contact information herein. Please read the disclosure statement carefully before you invest or send money.
A list of all recommendations made by TABR within the immediately preceding one year is available upon request at no charge. The sample client experiences described herein are included for illustrative purposes and there can be no assurance that TABR will be able to achieve similar results in comparable situations. No portion of this writing is to be interpreted as a testimonial or endorsement of TABR’s investment advisory services and it is not known whether the clients referenced approve of TABR or its services.

