Target Date Funds — Simple Solution, or Expensive Laziness?
In this edition of TABR’s quarterly newsletter, we’re going to present some analysis and thoughts on Target Date Funds, which have become quite commonplace in workplace retirement plans (401(k) and others). We’ll look at what they are, what they are designed to do, some of the differences among them, and how, in our opinion, they should be used, along with their pros and cons.
In addition, we’ll have an update on a diversified, passive strategy we introduced a couple of years ago, and whether or not past performance can be helpful in assessing future returns. Finally, I’ve included a recent client story that illustrates another way we add value in the process of serving you and others.
What is a Target Date Fund?
A target date fund (TDF) is a mutual fund or collective investment trust, that is designed to provide a simple solution to help a person invest for a projected retirement date, as well as for the period afterward. The portfolio mix, or allocation, becomes more conservative as the target date approaches. These types of funds are also known as life-cycle, age-based or glidepath funds.
Typically, the targeted retirement date is stated in the fund’s name, such as American Funds 2020 Target Date Retirement Fund (symbol AACTX). An investor planning to retire in 2020, or within a year or two of that date, might consider investing in this fund. These funds are “funds of funds,” as they invest in other funds, almost always within the same family of funds. Their appeal and selling point is that they’re supposed to be a simple investing solution—“set it and forget it.”
However, there can be significant differences between target date funds from different companies, as we will illustrate below. These differences range from their stock/bond allocations, to expenses, to investing style and types of exposure within asset classes (how much in international stocks vs domestic stocks, and different types of bonds).
Even though investors can purchase these funds on most brokerage platforms (Fidelity, Schwab, TD Ameritrade), they are mostly found within workplace retirement plans, and often are the default option. The default option means that if an employee in a plan has not selected where or how they want their funds invested, their money will automatically go into the option selected by the Plan Administrator.
What They’re Designed For
Since a plethora of research shows that most investors really have no idea how to properly diversify and invest their funds, the target date fund was created to make things simple, and in theory, be the solution with “one stop shopping.” Meaning, an investor does not need to do anything but save for retirement, as the fund takes care of diversification and allocation decisions. There is no need to invest in other funds.
| Year | Name | Symbol | Stock% | Bond% | 5 yr Return* | Expense Ratio |
| 2010 | American Funds Target Date | AAATX | 43.96 | 48.20 | 4.54% | 0.69% |
| 2010 | Vanguard Funds Target Date | VTENX | 32.69 | 62.43 | 5.14% | 0.14% |
| 2010 | T.Rowe Price Target Date | TRRAX | 42.74 | 49.89 | 5.28% | 0.58% |
| 2020 | American Funds Target Date | AACTX | 52.69 | 39.33 | 5.56% | 0.71% |
| 2020 | Vanguard Funds Target Date | VTWNX | 57.68 | 40.15 | 6.28% | 0.14% |
| 2020 | T.Rowe Price Target Date | TRRBX | 60.32 | 33.11 | 6.46% | 0.66% |
| 2030 | American Funds Target Date | AAETX | 73.69 | 18.57 | 6.70% | 0.73% |
| 2030 | Vanguard Funds Target Date | VTHRX | 72.86 | 25.62 | 6.83% | 0.16% |
| 2030 | T.Rowe Price Target Date | TRRCX | 74.66 | 19.56 | 7.29% | 0.72% |
| 2040 | American Funds Target Date | AAGTX | 82.18 | 9.83 | 6.77% | 0.74% |
| 2040 | Vanguard Funds Target Date | VFORX | 87.78 | 11.19 | 7.23% | 0.16% |
| 2040 | T.Rowe Price Target Date | TRRDX | 85.25 | 9.66 | 7.65% | 0.75% |
*for the five years ended May 31, 2016. Numbers are annualized.
Above is a limited comparison of the target date funds for three of the largest money management firms in the industry—American Funds, Vanguard and T.Rowe Price. I grouped the funds together based on the target date (2010, 2020 and so on) and for space reasons, omitted the data on the 2015, 2025, 2035 and 2045 funds. We’re able to compare the differences in allocations (stocks vs bonds), the returns and the fund’s expense ratio.
In terms of allocations, one can see that in the 2010 series, Vanguard has much less stock exposure at 32% than T.Rowe Price does at 42%, and the same is true of the 2020 series, with American Funds at 52% stocks and T.Rowe Price at 60%. In every grouping, for the 5 year period measured, American Funds had the lowest return and T.Rowe Price had the highest. And in this case, indexing, or using simply the lowest cost funds (Vanguard) did not result in the best performance. Despite charging anywhere from 0.44% to 0.59% more annually, T.Rowe Price beat Vanguard in every category. Both T.Rowe Price and American Funds espouse active management, while Vanguard is mostly associated with passive indexing.
These are just a few of the differences. Many of the approaches vary by company. For example, the Fidelity Freedom 2035 Fund (FFTHX) has 25 holdings, while the Vanguard Target Retirement 2035 Fund (VTTHX) has five. Others would include the amount held in foreign stocks, and different types of bond fund strategies. A reminder—diversification does not prevent losses. In 2008, the 2010 funds noted above lost anywhere from -20% to -27%, while the 2020 versions had losses ranging from -27% to -33%. Not many financial plans that are near or in retirement can afford to suffer losses of that magnitude and still last 20 or 30 years.
Some of the Negatives—Expensive Laziness
For many investors, selecting a target date fund within their 401 (k) plan is substantially better than consulting with your co-worker, or randomly picking the funds available with the highest five-year return. Let me be clear. It is a pretty good invention for legions of investors who don’t have the time or knowledge to monitor their investments.
They are not my preference, though, for two main reasons. You cannot control what the fund owns, and the allocations that a particular fund uses may not at all match the risk tolerance of the investor (though there is a solution for that).
As many of you are aware that have 401 (k) plans that we either manage directly or advise on, we build a custom matrix of the plan, which compares the investment options of the plan against one another on an on-going basis for relative strength purposes. The premise–especially with equity allocations, is to only own funds that are performing the best, and systematically sell them when they stop performing. This takes a little bit of work, but it’s well worth it.
We’ve written in recent written commentary about how this selection method works, and why for a few years now, we’ve had no international stock exposure within our core holdings. It’s because they are performing poorly, and are at the bottom of the rankings. Did you know that since September 2007, a period of nearly nine years, the Vanguard Total International Stock Index fund has lost nearly 14% (which included dividends)?
Yet, in virtually every target date fund, there will be foreign equity exposure, and it will likely vary from 15% to as much as 50%. Honestly, it doesn’t make sense to us to own an asset class, no matter what.
The second area I mentioned above regards matching risk tolerance. A target date fund treats everyone the same in respect to age. Let’s say you’re 56 years old today, and intend to retire at age 65, in the year 2025. Your company plan offers T.Rowe Price target date funds along with several other options. At first glance, you might select the T.Rowe Price 2025 Target Date Fund for your money. But, then you realize that this fund has 68% of its assets in stocks (which we consider to be fairly aggressive). By nature, you realize you’re a conservative investor. What do you do?
In our mind, this is the big negative with target date funds. This is where we’d recommend building a custom portfolio from the other funds available. In place of that, though, you could also select the 2010 target date fund, which only has 42% of its assets in stocks. Bottom line, target date funds aren’t for everybody, and they can be extremely costly for those not paying attention to what they own, but they can and do serve a good purpose for many investors who might otherwise haphazardly create a mix of funds on their own.
The New Department of Labor Fiduciary Rule
It’s possible that TDFs could trigger litigation and class action lawsuits under the new fiduciary rule that is supposed to go into effect sometime in 2017 or 2018. That’s because they don’t include defensible processes for matching portfolios to investor’s needs, as we’ve pointed out above.
As Paul Resnick, co-founder of FinaMetrica, pointed out in a May 2016 blog post, “It is difficult to reconcile the operation of TDFs with the Department of Labor (DOL) fiduciary requirements, coupled with the recent guidance from FINRA on standards of advice.
“The problem is the TDF assumes that all investors’ needs, circumstances and risk tolerances are the same. This assumption is clearly a folly.”
A Note on Expenses
The expense ratios cited above are for particular share classes of the respective fund company. Some of the companies have several share classes and the expense ratios can vary widely. In addition, many share classes are only available within retirement plans. For instance, we oversee a small 401 (k) plan for a company in Los Angeles, and use the American Funds family for the investments. As a fee-only registered investment adviser, we’re able to use their R5 share class, and that expense ratio for the 2015 Target Date Fund is 0.41% annually, but for the Class A shares noted above, it is 0.71%.
Even if one’s 401 (k) plan has a self-directed brokerage option (like ours does at Fidelity), an investor could not on their own purchase the R5 share class. Since the vast majority of the assets in target date funds are within company retirement plans, the overall expenses are not limited to fund expenses, but will vary based on the size of the plan, the type of adviser involved, the fund company, along with adviser compensation.
Can Past Performance Be a Guide to the Future?
No doubt you’ve heard the saying, especially in financial circles, “Past performance is no guarantee of future results.” This is plastered somewhere in every mutual fund and ETF prospectus, and in research regarding any investment strategy, hypothetical or real. For instance, though it may be true that since 1926, the S&P 500 has delivered a compound return of about 9.5% while government bonds have earned about 5%, this is of very little relevance to today, especially if our time horizon is that of a 20-year or 30-year period.
I got to thinking more about this topic several weeks ago after reading a piece in Morningstar by John Rekenthaler titled, “What Will Your Portfolio Return?” I am first reminded of the title of our latest monthly email—“Be Wary of Predictions, Brexit or Otherwise.” Yet, every week, we are holding client meetings, looking at planning projections that are going out 20 or 30 years or more, and assigning a probability of success to them. How do we reconcile that?
Good question. With planning work, I think it needs to be updated every year or two, as so many variables change—income, returns, inflation and withdrawals. Knowing the future is unknown, I’d still rather have a plan that suggests my success rate is 90% instead of 50%. But with stocks and bonds, there aren’t really methods that can be accurate much beyond 10 years. Bond returns are a function of bond yields, while stock returns are a function of dividends, earnings and price/earnings ratios.
In looking at the past, I’ve detailed below the returns of the Passive Index Mix using a variety of Vanguard Funds we created in the summer of 2013 (see TABR Newsletter September 2013).
| Total Bond VBMFX 20% | Inflation Bond VIPSX 10%* | High Yield VWEHX 10% | Small Cap NAESX 12% | MidCap VIMSX 12% | Large Cap VLACX 13%** | REIT VGSIX 7% | Int’l VGSTX 15% | Net Return*** | |
| 2000 | 11.39 | 11.00 | -0.88 | -2.67 | 18.1 | -9.06 | 26.35 | -15.61 | -2.46 |
| 2001 | 8.43 | 7.61 | 2.9 | 3.1 | -0.5 | -12.02 | 12.35 | -20.15 | -1.67 |
| 2002 | 8.26 | 16.61 | 1.73 | -20.02 | -14.61 | -22.15 | 3.75 | -15.08 | -6.54 |
| 2003 | 3.97 | 8 | 17.2 | 45.63 | 34.14 | 28.5 | 35.65 | 40.34 | 24.13 |
| 2004 | 4.24 | 8.27 | 8.52 | 19.9 | 20.35 | 10.74 | 30.76 | 20.84 | 13.03 |
| 2005 | 2.4 | 2.59 | 2.77 | 7.36 | 13.93 | 6.12 | 11.89 | 15.57 | 6.53 |
| 2006 | 4.27 | 0.43 | 8.24 | 15.66 | 13.6 | 15.49 | 35.07 | 26.64 | 12.69 |
| 2007 | 6.92 | 11.59 | 2.04 | 1.16 | 6.02 | 6.29 | 16.46 | 15.52 | 4.60 |
| 2008 | 5.05 | -2.85 | -21.29 | -36.07 | -41.82 | -37.08 | -37.05 | -44.1 | -25.77 |
| 2009 | 5.93 | 10.8 | 39.09 | 36.12 | 40.22 | 27.6 | 29.58 | 36.73 | 25.50 |
| 2010 | 6.42 | 6.17 | 12.4 | 27.72 | 25.46 | 15.63 | 28.3 | 11.12 | 14.2 |
| 2011 | 7.56 | 13.24 | 7.13 | -2.8 | -2.11 | 1.44 | 8.47 | -14.56 | 0.55 |
| 2012 | 4.05 | 6.78 | 14.36 | 18.04 | 15.8 | 15.94 | 17.53 | 18.14 | 12.00 |
| 2013 | -2.26 | -8.92 | 4.54 | 37.62 | 35 | 32.45 | 2.31 | 15.04 | 13.46 |
| 2014 | 5.76 | 3.83 | 4.58 | 7.37 | 13.6 | 13.24 | 30.13 | -4.24 | 6.70 |
| 2015 | 0.3 | -1.83 | -1.4 | -3.78 | -1.46 | 0.93 | 2.22 | -4.37 | -2.27 |
| 16yrs | 5.1 | 5.6 | 5.7 | 7.5 | 8.9 | 4.1 | 11.8 | 2.5 | 5.5 |
*Since the fund inception was June 2000, we used VBMFX for the first six months of 2000
**Since the fund inception was January 2004, we used VFINX (SP500 Index) for 2000 to 2004
***We assumed a 1% annual management fee, so these returns are net of that fee, and it is also assumed that these portfolios were rebalanced annually to the percentage weightings shown
A few observations are in order. The bond market, as measured by VBMFX, returned 5.1% over the full 16 years and 6% from 2000 to 2009. However, it began the period with a yield of 6.77%, which had declined to 3.82% in December of 2009, and was at 2.48% in December 2015. So, with the yield beginning at around 2.5%, it’s a good bet this portion of the allocation is going to earn between 2% and 3% (including inflation bonds) the next 10 years.
In high yield corporate bonds, the yield in December 1999 was 8.60%, jumped to over 10% in December 2008 and began 2016 at 5.63%. So, the 16-year return of 5.7% did not match its beginning yield. With junk bonds, one cannot bank on a starting yield, because of the uncertainty of defaults, so today’s approximate yield of 5.6% is not something one can “take to the bank.” Since this area has been highly correlated with the performance of the stock market in recent years, we continue to feel being tactical with high yield will be far superior in coming years to passively holding on. The recent 10% plus decline which started last summer and ended in late February was the largest decline since 2011, but if the past is any indication, there will be an even better opportunity ahead at some point.
In stocks, it’s notable that both small companies and mid-caps nearly doubled the 4.1% return of the large companies during the last 15 years. Since large stocks were extremely expensive at the end of 1999 based on the Shiller PE Ratio (it was above 40), that definitely helps to explain why large companies have been below par for so long—when you pay too much for something (anything), the future return is going to be poor. One of the big reasons small and mid-cap stocks did so well on a relative basis is because they were quite undervalued in late 1999. That is not the case today. Now, all three areas (large, mid-cap and small) are expensive based on historical precedents.
As I’ve illustrated in past letters, when the Shiller PE has been above 25 in data going back to 1926, the median future 10 year return of the S&P 500 has been 2.9%, with a best case of over +9%, and a worst case of nearly -10%.
Before I put this all together and come up with a likely range of passive returns for a balanced portfolio going forward, let me touch on the final area of real estate. I’m not talking about the value of your home or a rental and how that did. As shown above, we used the Vanguard REIT (real estate investment trust) as a liquid proxy for this asset class, and it had the best return of any area, 11.8% compounded for 15 years. See the monthly chart below, courtesy of www.stockcharts.com.
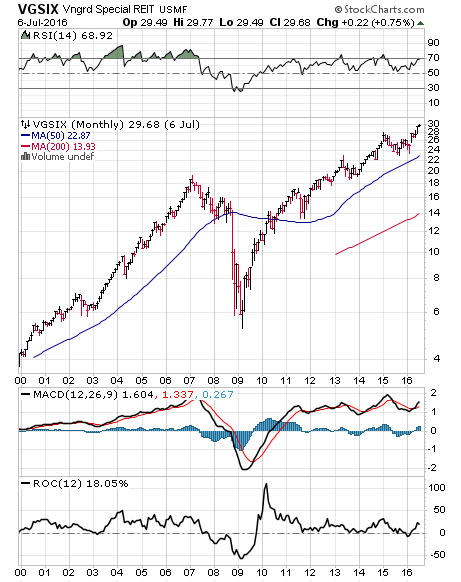
In late 1999, this asset class, dominated by commercial real estate, was grossly undervalued, and the fund was paying a yield of over 8.3% at that time. Today, that starting yield is down to 3.77%. Needless to say, it’s not likely one is going to earn 11% in the next 10 to 15 years. Given the high correlation with stocks, when there is a substantial decline, REITs are also likely to suffer.
I realize that many real estate aficionados have a belief that real estate can only go up, but that is not prudent thinking. Just like the stock market and bond market, right now, real estate is more expensive on a general basis than ever before. It would not be far-fetched to see the Vanguard REIT Fund noted above only earn its yield in coming years, with some substantial downside at some point.
Where Does That Leave Us?
Remember—what I’m discussing here are passive, buy and hold returns from today, looking out 10 years. So, the bond side is likely 2%, maybe 3%. That’s 50% of the equation. Then, you get into who do you want to believe (or what method)? Jeremy Grantham from value shop GMO is expecting 0-2% returns for U.S. stocks. Jack Bogle, formerly of Vanguard, expects 4%-6% for stocks. Current Vanguard CEO Bill McNabb feels equities will return 6% to 7%. Most U.S. pension funds, including CALPERS and CALSTRS, are banking on 7.5% for the long term. Mutual fund manager and researcher John Hussman is also looking at 0-2% returns, with a lot of downside, as much as 40% to 50%.
Anything is possible with markets, but I don’t think it is likely that P/E ratios will expand from their current bloated levels. If anything, contraction is more probable. To me, the data suggest stock returns of about 3%, give or take, which means balanced portfolios would be in that range as well, with a decent amount of downside at some point (a recession is overdue).
In my view, though, the better news is that substantial declines in stocks and high yield corporate bonds will provide excellent opportunities to get better returns and a tactical process is the best way to navigate through the storms. Fortunately, as we analyze the various planning scenarios for a large number of clients, we continue to find most of them should be able to meet their goals, even in the likely low return environment that appears ahead. I don’t think anything is going to come easy, though.
So, as we all reach for yield in a quest to generate higher returns in a low return world, some lyrics come to mind from a new Don Henley song from his latest album called Cass County. I believe the song is about rekindling an old relationship, and is called That Old Flame, but the following lyrics from a section of the song could easily describe what is going to happen to many investors who are chasing returns here:
“Cause there is danger in the embers
And you have only yourself to blame
If you get burned when you try to rekindle
That old flame”
What We Do When No One’s Looking
Several months ago, I was driving our 11-year-old daughter Caroline to our office so I could work a bit on a weekend when she blurted out, “Daddy, what do you do at work?” That couldn’t be answered in just a few minutes, but it gave me the idea to start a section for the newsletter that hopefully will share some stories about the different things we do for clients. We’ve come to realize that many of you don’t always have a full grasp of all the areas we get involved in. I can assure you, it’s not just managing your money. But if we don’t communicate these examples, how would you know? A number of you have remarked—“gee, I didn’t realize you could help us with that.”
So, for this issue, here is a story about the process we use in evaluating all the areas for a potential new client. In the first meeting, we’ve been in the habit recently of asking them “what is the most important part of a jigsaw puzzle?” Sometimes, they will answer the corner, or the bottom, or the top, or the edges. All good answers. But, when it comes down to it, the most important part is the picture on the top of the box. Without it, you don’t how to complete it.
And, that’s why we gather at an initial meeting all of the following items—retirement plan statements, bank accounts, brokerage accounts, tax return, estate planning documents, life insurance policies, college plan statements, a budget expense worksheet, annuity contracts, Social Security benefit statements, pension statements, mortgage statements and a listing of all real estate properties and debts.
At this particular first meeting, our potential client, who was referred to us by a close friend, came in on a Saturday morning with a pile of documents about 2 feet high. Steve Medland and I spent over two hours with him learning about everything, and one of the things I was aware of was that Eddie (not his real name) had lost his wife to cancer back in 2013.
At the conclusion of a typical first meeting like this, our promise is then to deliver a written summary of everything, our recommendations, what we would do, what we would charge, and also produce an initial planning document. A week later as I was going through Eddie’s documents, I remembered that I needed to check with him or his estate attorney to make sure that when his wife had passed away, they had taken the step-up in basis on their Southern California home, which was valued at over $2 million. I ended up speaking with Eddie’s estate attorney and indeed verified that this had taken place when he had filed Form 706 for the estate.
Fortunately for Eddie, I did not stop there. He had a long standing trust account with a bank trust department and the statement we were looking at in January showed that there were over $700,000 of unrealized capital gains in the account, almost all from various individual stocks. And then it hit me. Had anybody bothered to check if the bank trust department had stepped up the basis on all of the stocks as of the date of Eddie’s wife’s death?
When I compared the figures on Form 706 to the current statement, I could tell this had never been done. And this was a big deal. I drafted a letter to the advisor at the bank, which was signed by Eddie, and provided all the cost basis information that was necessary to update the account. We submitted the request in April, and they had it fixed by the end of the month. At the end of March, the unrealized gains were up to $900,000, but after the statement was corrected, they ended up at $500,000.
What did we do? By knowing what to ask and doing some reconnaissance, we have potentially saved Eddie about $136,000 in capital gains taxes on $400,000 (24% federal and about 10% state), and we hadn’t even been hired yet. I might add that Eddie’s current advisor at the bank did not catch this, his CPA / tax preparer did not catch this nor did his estate attorney. But we did.
I realize that not every situation will have circumstances such as the above, but the story is more about the depth that we delve into in order to understand a client’s situation, which allows us to serve them better. In this case, we added tremendous value, and it had nothing to do with beating the market or generating excess returns. Portfolio management is certainly critical, but sometimes, planning issues dwarf the importance of generating an extra 2% a year. As they say in baseball, you can’t score if you don’t touch all the bases.
We’ll be touching on other examples of client stories in upcoming newsletters, to showcase some of the areas you may not be aware we are involved in, and to also help answer the question, “Daddy, what do you do at work?”
That’s it for now. It’s hot in Yorba Linda, and hopefully, you’re enjoying the beginning of summer. Our target for the next letter is late August, and then late November.
All of us at TABR are grateful for the trust and confidence you express in us daily.
Sincerely,

Bob Kargenian, CMT
President
TABR Capital Management, LLC (“TABR”) is an SEC registered investment advisor with its principal place of business in the state of California. TABR and its representatives are in compliance with the current notice filing and registration requirements imposed upon registered investment advisors by those states in which TABR maintains clients. TABR may only transact business in those states in which it is notice filed, or qualifies for an exemption or exclusion from notice filing requirements.
This newsletter is limited to the dissemination of general information pertaining to our investment advisory/management services. Any subsequent, direct communication by TABR with a prospective client shall be conducted by a representative that is either registered or qualifies for an exemption or exclusion from registration in the state where the prospective client resides. For information pertaining to the registration status of TABR, please contact TABR or refer to the Investment Advisor Disclosure web site (www.adviserinfo.sec.gov.).
The TABR Model Portfolios are allocated in a range of investments according to TABR’s proprietary investment strategies. TABR’s proprietary investment strategies are allocated amongst individual stocks, bonds, mutual funds, ETFs and other instruments with a view towards income and/or capital appreciation depending on the specific allocation employed by each Model Portfolio. TABR tracks the performance of each Model Portfolio in an actual account that is charged TABR’s investment management fees in the exact manner as would an actual client account. Therefore the performance shown is net of TABR’s investment management fees, and also reflect the deduction of transaction and custodial charges, if any.
Comparison of the TABR Model Portfolios to the Vanguard Total Stock Index Fund, the Vanguard Total International Stock Fund and the Vanguard Total Bond Index Fund is for illustrative purposes only and the volatility of the indices used for comparison may be materially different from the volatility of the TABR Model Portfolios due to varying degrees of diversification and/or other factors.
Past performance of the TABR Model Portfolios may not be indicative of future results and the performance of a specific individual client account may vary substantially from the composite results above in part because client accounts may be allocated among several portfolios. Different types of investments involve varying degrees of risk, and there can be no assurance that any specific investment will be profitable.
The TABR Dividend Strategy presented herein represents back-tested performance results. TABR did not offer the Dividend Strategy as an investment strategy for actual client accounts until September/October 2014. Back-tested performance results are provided solely for informational purposes and are not to be considered investment advice. These figures are hypothetical, prepared with the benefit of hindsight, and have inherent limitations as to their use and relevance. For example, they ignore certain factors such as trade timing, security liquidity, and the fact that economic and market conditions in the future may differ significantly from those in the past. Back-tested performance results reflect prices that are fully adjusted for dividends and other such distributions. The strategy may involve above average portfolio turnover which could negatively impact upon the net after-tax gain experienced by an individual client. Past performance is no indication or guarantee of future results and there can be no assurance the strategy will achieve results similar to those depicted herein.
For additional information about TABR, including fees and services, send for our disclosure statement as set forth on Form ADV from us using the contact information herein. Please read the disclosure statement carefully before you invest or send money.
A list of all recommendations made by TABR within the immediately preceding one year is available upon request at no charge. The sample client experiences described herein are included for illustrative purposes and there can be no assurance that TABR will be able to achieve similar results in comparable situations. No portion of this writing is to be interpreted as a testimonial or endorsement of TABR’s investment advisory services and it is not known whether the clients referenced approve of TABR or its services.