The Conundrum Of Technicals vs Fundamentals
What a difference a year makes. A year ago at this time, all of our stock and bond market risk models had turned negative, we were in maximum protect mode, and that foreshadowed the worst calendar year for investors since 2008.
Today, all but one of our stock market risk models is positive, and we’re nearly fully invested across the board with our tactical portfolios, which is the vast majority of the money we manage for clients.
Will this January’s improvement correlate to a strong 2023? That’s the question of the day, which we’ll explore in this month’s update, along with our usual lookback at the previous year.
It’s Rare To See Two Down Years In A Row
In the last 80 years dating back to 1942, the stock market as defined by the S&P 500 Index, has declined in a calendar year 17 times. This is illustrated in the table below, courtesy of the great work by Charlie Bilello, at www.compoundadvisors.com. This suggests, that randomly, stocks should gain in a 1 year calendar period about 75% of the time, regardless of other factors. Lest I be accused of data mining, I should add something to this statement. From 1928 to 1941, stocks lost money in 9 of 14 years. Look for yourself. This changes the overall count to 26 down years out of 94, but that’s still a 27% success rate for all years. Close enough for horseshoes, as they say.
I also should note that stocks were down for four years in a row from 1929 to 1932, and again for three years in a row from 1939 to 1941. Those periods coincided with the Great Depression of the 1930s, and the beginning of World War II. Many analysts today discard these periods from their analysis, as if they couldn’t happen again. Perhaps, but we think a more balanced approach is viable. All in all, the long term trend of the U.S. stock market is up, but there are cyclical periods where returns are muted.

With 2022 being one of the years in the red, what are the odds of a repeat this year? Since 1942, that’s only happened twice–back in 1973 and 1974, and again in 2000, 2001 and 2002. Those aren’t very good odds for being negative. Every so often, with our interactions with clients, we’ll hear something like this—“Man, the country’s going to hell. Things don’t look good.” Or variations of that theme. But unless we’re headed for another depression, being long term negative doesn’t jive with the data.
Let’s also throw some election cycle tendencies into the mix as well. Mid-term election years, of the four years in the Presidential Cycle, are the least productive of the four. In contrast, pre-election years are the strongest of the four. Last year lived up to history, with most stock indexes down double-digits across the board. But, since 1939, every post Mid-Term Election Year has been positive (21 in a row), and furthermore, when the Mid-Term Election Year has been poor (see 1962, 1966, 1974, 1990, 1994, 2002 and 2018), stocks have responded very strongly to the upside the following year.
Below is the Ned Davis Research Cycle Composite for 2023 for the S&P 500 (courtesy of www.ndr.com). This chart combines equal elements of the One-Year Seasonal Cycle, the 4-Year Presidential Cycle and the 10-Year Presidential Cycle.
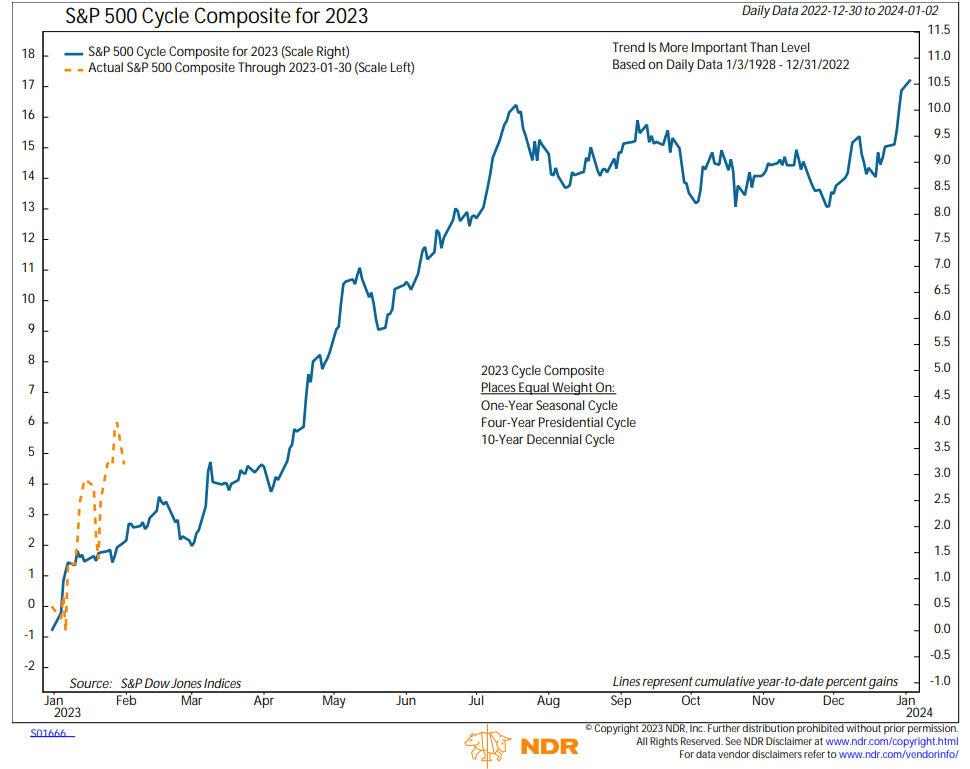
The chart suggests stocks should trend higher into July, then go sideways until December. As I write this on January 31 with only a couple of hours left in the trading day, the month has followed the script really well, with the S&P 500 up 5.6%, the NDX 100 up 10.13%, and the EFA (Europe) up 8.66%.
Should We Trust The Thrust?
I often talk about market breadth indicators in these updates. Just as blood work and the condition of our heart, among other things, helps determine our individual health, market breadth indicators tell us a lot about the internal “health” condition of the stock market. Since late December, the technical condition of the market has been improving, with many indexes crossing above their respective 200-day moving average, including two-thirds of the components in the S&P 500.
A couple of weeks ago, a breadth thrust occurred. I should note that there are various “thrust” indicators that Ned Davis Research and others maintain. They typically measure variations of the advance/decline line, which is a measure of the number of stocks advancing each day compared to the number of stocks declining. The measurement period can range from 5 days to 10 days, and sometimes even 30 days. Not all thrust indicators are created equal, and some are more effective than others. The rationale is displayed by thinking of a rocket ship, and its boosters. The amazing power generated at lift-off pushes the rocket into outer space and it keeps going and going, for some time.
Last year, several thrust indicators fired, but so far, most of them have not lived up to their past. As they say in finance, “past performance is no guarantee of future results.” Nothing is perfect, and nothing works all of the time. All models fail at some point. However, a couple of weeks ago, the iteration of a breadth thrust shown below, courtesy again of Ned Davis Research, fired. This measures the 10-day advance/decline line, which must rise above 1.9. This concept, as far as I can find, was created by market technician Walter Deemer.
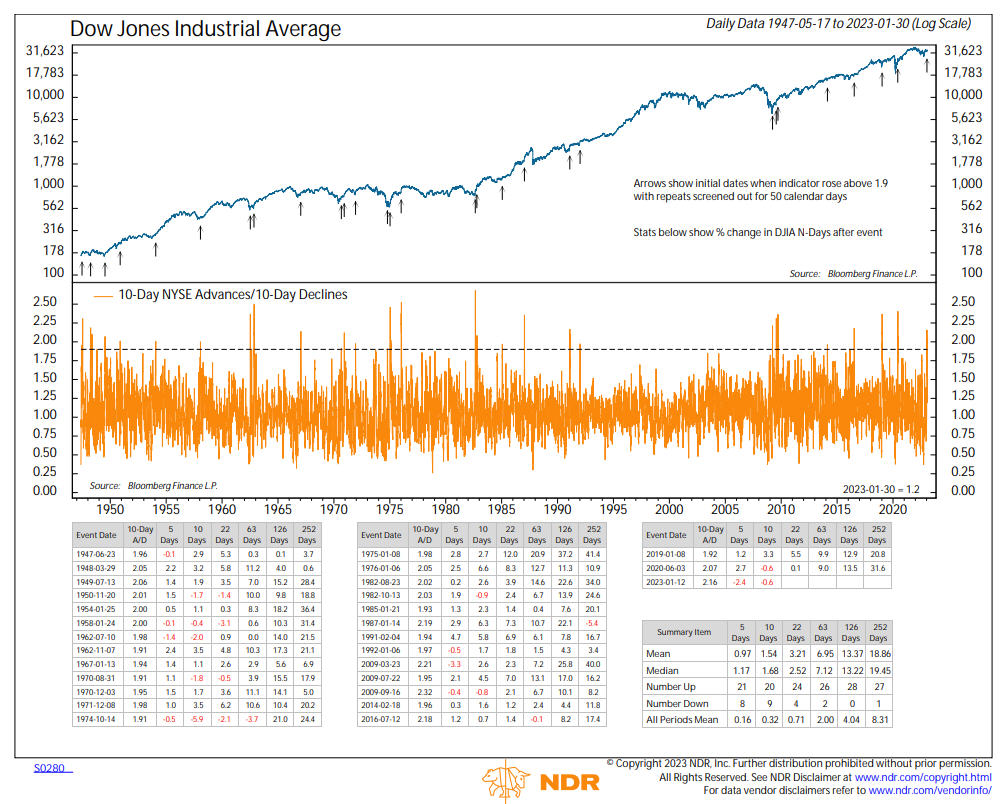
I’m featuring it because not only of its strong historical record, but because it didn’t fire last year at all. That makes current conditions different than last year, and the other thrust indicators that did fire. We’re also seeing this in our own stock market risk models, as you’ll read in the Portfolio Allocations section below. There have been 28 prior instances with the indicator since 1947. Six months later, there has never been a loss, with median gains of over 13%, compared to the normal median of 4%. There have also been only 2 losses three months out, and only one loss 1 year later. We deal in probabilities, and those are pretty good odds.
The Bearish Fundamental Case
The technical evidence has been improving, some of which is emphasized above. As I’ve written though (November Monthly Update), one shouldn’t dismiss the inverted yield curve, and its past historical relationship with predicting a recession. That is still on the table. There can be long lead times. As I write this, the yield on one-year Treasury Bills is 4.71%, while the 10-year Treasury is down to 3.52%. The yield on 3-month Treasury paper is almost identical to that of the 1-year, at 4.72%. Here’s the problem. Everyone in the world, including me, has been expecting a recession, based on this type of analysis. When opinions and actions get to be one-sided, the markets tend to do the opposite. It’s very possible that a recession has already been discounted in stocks. We’ll certainly find out in the next few weeks, as a couple of hundred companies in the S&P 500 will be reporting quarterly earnings.
Last week, a couple of big names reported, Boeing and Microsoft. Neither report was very positive. Initially, MSFT opened down nearly -4% the next morning, but closed down less than -1%, then surged nearly 4% the following day. Boeing also shrugged off a not so hot report, and importantly, didn’t go down. With markets, it’s not always the news, but the reaction to the news. These are just two examples, but the implication may be that most or all of the bad news is already in the market. We’ll find out more later this week, as Apple, Amazon, Google and Eli Lilly all report after the close on Thursday.
From a valuation standpoint, it is hard to make the case that stocks are cheap. They’re not. Even after last year’s declines, many valuation indicators are still in their 85-90% ranges historically, meaning that in history, they are in the upper 10-15% of their range. Say what you want about the Shiller P/E Ratio, which measures the 10-year smoothed earnings of the S&P 500, but it stands at over 27, while its modern-era ratio is about 19.6 (it’s closer to 16 if you go back to 1926). Valuation indicators, though, are rarely useful for timing. Another we pay very close attention to is the VLMAP, the Value Line Median Appreciation Potential, which is shown below in a carve out of the latest weekly Value Line report.
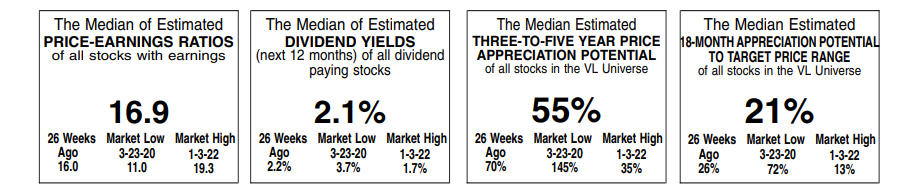
The latest reading comes in at 55%, after bottoming at 35% at the exact top in early January 2022. The indicator has a low to high range from 25% to over 200% historically, going back to the late 1960s. It peaked in early October 2022 at 85%, and combined with some other technical evidence which showed that stocks were extremely oversold, we increased our equity allocation at that time. The S&P 500 has risen about 12% since that time. Now, we’re in no man’s land. I’m hopeful that prices will continue to rally, as we would look to liquidate our positions if the indicator approaches its January 22 lows.
Probably the biggest obstacle the market has at this point is the Fed, and monetary policy. The Fed embarked on a tightening campaign last March, and has since increased the Fed Funds rate from 0 to 4.25%. They are widely expected to increase rates on Wednesday to 4.50%, but what they say about the future is likely more important. There is no doubt that higher yields last year have had a significantly negative effect on stock prices. But, at some point, higher yields get priced into stock prices, and the market begins to look to the future. If the Fed remains hawkish, and implies they will be raising rates higher for longer, that may not be in the market (and probably isn’t), and markets may react negatively, maybe even stopping this rally in its tracks.
There’s no way to know that. Which is why we follow the data, and not our feelings. One of the biggest mistakes investors make is trading based on what they feel rather than what the data is telling them. When push comes to shove, we always favor the technical data over fundamental data, and right or wrong, right now the technical data is pretty positive.
Portfolio Allocations
By the end of January 2022, we were in max protect mode, with all of our tactical stock models negative. We entered 2023 at only 20% long tactically, and a very unfortunate high yield bond SELL on January 3. Things have changed dramatically since then. On January 17, two of our stock models flipped positive, and high yield went back on a BUY, and on January 30, a fourth stock model went positive. Our fifth and final stock model is improving, and it could also go positive in coming weeks. Bottom line, our tactical equity exposure is up to 80%, and we’re fully invested in high yield bond funds and the PIMCO Income Fund. Not all BUY signals result in profits, and not all SELL signals result in lower prices, but as the evidence changes, we change. As you’ll see below when we recap how our various portfolios performed last year—we didn’t lose significantly less last year than benchmarks because we thought markets were headed lower and acted appropriately—we simply followed the directions of our various models.
The Not So Happy Place On Earth
My daughter and wife have premium annual passes to Disneyland/CA (California Adventure). So do my in-laws. I vaguely remember this being a contractual requirement to marry their daughter 30 years ago. We also have a number of clients who either work for Disney, or have close ties. You’d think that our daughter’s 40 visits last year would have boosted the stock price, but alas, look below.
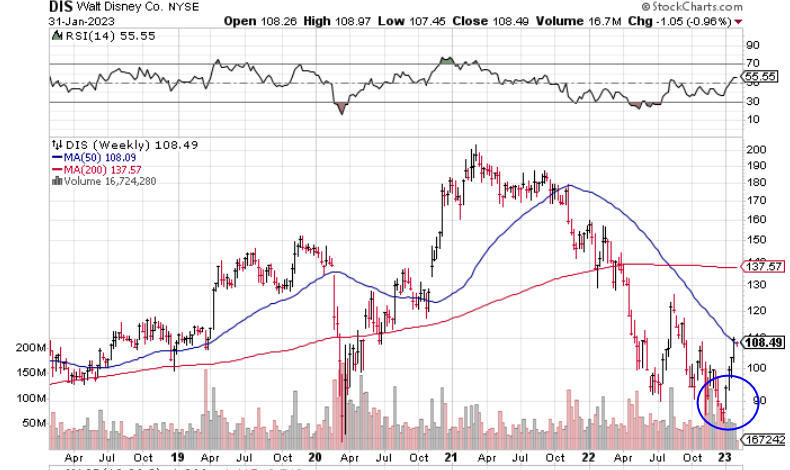
This chart goes back 5 years, and one can see the big decline in 2020 related to Covid, when the parks had to shut down, and the stock plunged from about 150 to 80, and then rebounded to over 200. In December, the stock was trading below 90, nearly matching its March 2020 covid lows. Fundamentally, there are a lot of issues. They had to eliminate the dividend in 2020 and have yet to restore it. They started a streaming business which continues to rake in increasing revenue, but they haven’t been able to figure out how to make a profit from it—the more revenue, the bigger the losses. There are issues at ESPN, and going to the parks isn’t cheap. Most of you who go know exactly what I mean.
A week ago, one of the brilliant students in the Titan Capital Management class that I help with as a board member wrote an excellent report as to why the students wanted to sell the stock from one of the portfolios they run. This got me to thinking. He made great fundamental arguments. And technically, the stock is not attractive either. But, how often does one get to purchase perhaps one of the top 20 brands in the United States (just guessing there) at almost -50% off? Not often, I might add. This isn’t a recommendation, and it’s only backed up by my 40 some years of market wisdom. Unless you think their brand is permanently tarnished, and that Bob Iger is incompetent, I’d suggest that about 3 years from now, this would be a pretty good return on investment. Who knows, I might even put 100 shares in our account just so I can write about this again in 3 years.
You Want Inflation? I’ll Give You Inflation
The battle to tame overall inflation from last year’s peak of over 9% is far from over, though the year-over-year comparisons in April of this year, and especially May and June, are likely to see numbers in the 4% range, barring some surprises. That’s the good news. Crude oil, now around $80, was at $120 last March, and real estate peaked around May. But, not everything is so rosy. Take a look at our latest monthly bill from Southern California Gas Company.

At the risk of being the target of wrath from our east coast clients (ha–you guys in California can’t spell the word COLD), this really isn’t about the fact that we are using our heater more than normal this winter. And likely, neither are any clients. Going back to last November, our AVERAGE bill for about the past year has been $122, with a low of $46 in May and a high of $207 in December. So, as today’s journalists write, WTF? I can make it even more perplexing if I were to add the chart of Natural Gas, which is back to its level of about 1 year ago, and is some -75% off its August peak. So, what’s happening? If you’ve not read about this, it’s all about tighter supplies of liquified natural gas. This commodity accounts for more than 33% of Americans’ electricity.
Even though prices have plunged, after a record surge, the United States is shipping record amounts of natural gas to Europe to replace lost imports from Russia, as a result of their on-going war with Ukraine. Since June, the U.S. has been the world’s top exporter of natural gas. Unlike with crude oil, the U.S. is not dependent on the rest of the world for natural gas, but for the first time, American consumers are being affected by global issues that are related to our electricity bills. I wish it were as simple as stopping the exports of natural gas, but as in life, it’s complicated. I pray this doesn’t last long. I know we’re not alone. A client told me over the weekend that their daughter’s household bill in Corona was over $800. Darn, guess we got a bargain!
Spring can’t get here quick enough, because if this were to keep up, you’ll get your recession. Heck, we won’t even be able to afford Taco Tuesdays. Is the $1 menu at Del Taco, still $1?
A Look Back At 2022
We’ve always found it useful to look backwards and contemplate what we’ve done. This can be helpful even when things seem to be going right, but even more so when they’re not. It’s how one can make course corrections, and fix things.
Transparency has been a fixture at TABR since we were founded in 2004. The vast majority of RIAs in our business do not publish a track record. They may cite compliance issues, or the work necessary to comply with regulations, or that all their clients have “customized” portfolios. Simply put, we do publish one, because we believe in our process, and our staff backs that up by investing the vast majority of their personal savings in the exact same strategies we use for clients.
Sometimes, the numbers aren’t pretty, and other times, they are great. That is part of being in investment management. Even the best money managers in the business go through years of underperformance. We are no different. The key is, in our view, sticking with your discipline, but also having the courage to fix things when something may be amiss.
And though below you will see comparisons to industry benchmarks, ultimately we are judged by helping our clients achieve their goals, with substantially less risk than passive, buy and hold strategies. Besides our combined 57 years of financial planning and investment management wisdom, that is probably the one big difference and edge we have over competitors.
Last year in financial markets was pretty much unprecedented, with both stock and bond indexes down double digits. The Vanguard Total Bond Index was down -13.25%, its worst year in history, and down more than many value-oriented stock indexes. For the first time in many years, the Vanguard Total International Stock Index Fund outperformed domestic stocks, losing -16.05% in comparison to the Vanguard Total Stock Index Fund, which fell -19.20%. Our tactical models did their job, as we would want them to do during significant market declines, limiting losses to the -7% to -8% range for blended accounts, and just over -5% for our all-bond strategies. All in all, our tactically managed accounts beat their passive benchmarks by 700 to 800 basis points across the board. In baseball, that would be considered a grand slam. But know there is no complacency on our end. We will lag strongly trending markets to the upside, especially in the beginning stages of a move (such as now), when a market is transitioning from a bearish trend to a bullish trend.
Stock And Bond Allocations
By the end of January, all of our tactical stock market risk models had turned negative, and they remained in that position until early August. This was key in preserving capital, as the S&P 500 Index cascaded its way down from the 4500 level to near 3600/3700. Since we maintain a floor of 20% equity exposure, composed of Fidelity Sector Funds and a Vanguard Total Stock Fund, we were minimally invested in stock funds for the first 8 months of the year. After the August bottom, two of our five models flipped back and forth the remainder of the year, and we entered 2023 with just one of five models in a bullish mode. Having less exposure during a major downtrend is what it’s all about, but it’s the opposite during a major uptrend. You want as much exposure as possible, within one’s risk parameters. As mentioned above, in the past few weeks, three of our models have turned bullish, so we’re presently at 4 out of 5, so obviously, it would be great if this trend continues to the upside.
Besides how much you own, what you own is also very important. This is why we use the concept of relative strength to determine what to buy. This also really aided our performance in 2022, as every month, we examine and rank a list of 20 broad-based ETFs which represent stock market exposure in virtually all broad areas–large stocks, mid-cap stocks, small stocks, international stocks, along with growth and value segments in those areas. Had you maintained an equal-weighted version of the top 3 funds during the year, and used our sell discipline, you would have had performance of about -15.4%. That’s about 300 basis points better than the benchmark, which is nothing to sneeze at. Where we really got a bump, though, was from our sector exposure. On February 1, our monthly sector process moved two of the four funds into Fidelity Select Energy and Fidelity Select Natural Resources, and these two funds proceeded to kick butt for most of the rest of the year, with energy related stocks being about the only thing that went up.
As a result, had you equally weighted our 4 sector funds and re-balanced each month (which we don’t), one would have lost about -4.82%, which is a huge improvement over the S&P 500’s return of -18.23%. Getting out of the way of falling bond prices also helped tremendously, and our risk models for high yield bond funds did their job, switching to ultra-short bond funds on SELL signals. We have a similar risk model that we apply to the PIMCO Income Fund. The vast majority of high yield bond funds, such as Blackrock, PIMCO, Prudential, Putnam and others, lost between -10% and -12% for the year, while our TABR Bond Account fell just over -5.00%. We also maintain a position in the Sierra Strategic Income Fund, which uses similar defensive tactics as we do, and that fund fell -4.91% for the year, doing its job in a big downtrend for bond prices.
You could imagine that passive, fully-invested strategies did not fare well in 2022. That’s the weakness in the passive approach. It plays no defense. Our passive account, which uses a mix of Vanguard funds, fell nearly -17%, which was nearly double the losses of our tactical moderate accounts. That’s just the way it works, though. In strong markets, the passive account will do better, and sometimes, much better, and the month of January is already showing this. Finally, we have a fully-invested stock strategy that uses individual stocks, which we call our OEX Relative Strength account. It did lose nearly -17%, but since its inception in February 2020, it has beaten the S&P 500 Index by nearly 600 basis points per year. Now that I’ve written that, it’s bound to give up some ground! That is actually happening as we speak, as the rally from late December has been led by the stocks that got beaten up the most last year, the growth and technology sectors. That’s not what we own, and this is normal when markets turn. The worst stuff does the best, and the best stuff lags. Eventually, though, relative strength takes over. Nothing has an edge every year, or even every few years.
As I wrote last year, these fully-invested portfolios have their place for those willing to stomach the greater downside in exchange for greater upside with a portion of their savings. I’m reminded of Morgan Housel’s The Psychology of Money, which we mailed out in November 2021. In one section, he writes “My own theory is, that in the real world, people do not want the mathematically optimal strategy. They want the strategy that maximizes how well they sleep at night.” That best describes our tactical work, which is the heart of who we are.
Below is the performance, net of management fees, of TABR’s six different portfolios at present. These represent a majority of the strategies we are using in client accounts, but not all. The differences are mainly attributed to risk (example–moderate allocation versus conservative allocation or aggressive) and account size. The numbers are for the time periods of the past year, the past 5 years and 10 years (if applicable) in accordance with SEC performance reporting requirements. We’ve also provided appropriate benchmarks for each strategy.
| Type Of Account/Strategy | 2022 Return | 5 Years Ended 2022 (or since inception) | 10 Years Ended 2022 (or since inception) |
| TABR Tactical Moderate | -8.12% | 2.21% | 2.46% |
| Moderate Benchmark (40/15/45)* | -16.05% | 3.80% | 6.00% |
| TABR Tactical Conservative | -7.67 | 1.73% | 1.92% |
| Conservative Benchmark (30/10/60)** | -15.32 | 2.80% | 4.70% |
| TABR Bond Account | -5.04 | 0.70% | 1.60% |
| Bond Benchmark (Vanguard Total Bond VBMFX) | -13.25 | -0.30% | 0.80% |
| TABR Passive Index Mix (Moderate) | -16.79% | 2.82% | 4.82% (since 12-31-15) |
| TABR Tactical Stock (100% stock/tactical) | -11.11% | 6.58% (since 12-31-18) | n/a |
| Tactical Benchmark (75/25)*** | -18.41% | 10.80% (since 12-31-18) | n/a |
| TABR Relative Strength OEX S&P 100 | -16.77 | 13.73% (since 2-24-20) | n/a |
| Relative Strength Benchmark (VFINX 500) | -18.23% | 7.90% (since 2-24-20) | n/a |
| Vanguard Total Stock Market Index (VTSMX) | -19.20% | 8.70% | 12.0% |
| Vanguard Total International Stock Index (VGTSX) | -16.05% | 1.00% | 4.0% |
Note–all returns cited include reinvested dividends.
*consists of 45% Vanguard Total Bond, 41.25% Vanguard Total Stock and 13.75% Vanguard Total International Stock
**consists of 60% Vanguard Total Bond, 30% Vanguard Total Stock and 10% Vanguard Total International Stock
***consists of 75% Vanguard Total Stock and 25% Vanguard Total International Stock
No, Bob’s Not Retiring!
That might be a natural question, given that I turned 65 in November, and now officially have my own Medicare card. But, nothing’s changed. Perhaps you remember that I have a 17-year-old daughter, who will be entering college in the fall. Her passion is to become a veterinarian, which means 4 extra years of college. I’ve got work to do! I will actually address this topic in more detail later this year, as I think it’s appropriate to share and be transparent with where TABR is headed. For now, though, the following will have to suffice.
I’m pleased to provide written notice that Steve Medland recently increased his ownership percentage of TABR Capital Management to 33%. Because the equity ownership structure of the firm has changed by more than 25%, the Investment Advisers Act of 1940 considers this to be an “assignment” of our management agreement with our clients and requires that we get consent for this change. In practice, this change should have virtually no effect on the management of your accounts or our day-to-day operations. To keep things simple, we will assume that you consent to this assignment if you don’t let us know otherwise within 60 days of this notification. If you wish to withhold your consent to the assignment, please notify us by either emailing us, or via regular mail. Please let us know if you have any questions. Thank you.
Bob Kargenian and Steve Medland
Material Of A Less Serious Nature
Three members of the church Men’s Club were asked by their priest, “When you’re in your casket, and friends, family and members of the congregation are mourning over you, what would you like them to say?”
Art said: “I think I’d like them to say that I was a wonderful husband, a fine spiritual leader, and a great family man.”
Eugene commented: “I would like them to say I was a wonderful teacher and servant of God who made a huge difference in people’s lives.”
Sammy said: “I’d like them to say, “Holy $hit, he’s moving!'”
My late Dad would appreciate that, being he was the best mortician in Tulare, CA for about 40 years. “Our prices start at six feet under and go up from there,” was one of many industry-related jokes I heard growing up with him. Speaking of mourning, if you speak with me in about the next year, and you detect sadness in my demeanor, that’s because my dreams and prayers of Brock Purdy leading my Niners to win the Super Bowl were shattered by a missed block (and a key missed call). I almost don’t want to watch on February 12. Geez–Chiefs vs Philly. They’ve both won the Super Bowl in the last five years, so it’s not as if their fan bases are starving. I hope the game ends in a tie! That’ll fix them.
Thanks for getting this far. We wish all of you a prosperous 2023, and know that all of us at TABR take quite seriously the trust and confidence you place in all of us, and appreciate you.
Sincerely,

Bob Kargenian, CMT
President
TABR Capital Management, LLC (“TABR”) is an SEC registered investment advisor with its principal place of business in the state of California. TABR and its representatives are in compliance with the current notice filing and registration requirements imposed upon registered investment advisors by those states in which TABR maintains clients. TABR may only transact business in those states in which it is notice filed, or qualifies for an exemption or exclusion from notice filing requirements.
This newsletter is limited to the dissemination of general information pertaining to our investment advisory/management services. Any subsequent, direct communication by TABR with a prospective client shall be conducted by a representative that is either registered or qualifies for an exemption or exclusion from registration in the state where the prospective client resides. For information pertaining to the registration status of TABR, please contact TABR or refer to the Investment Advisor Disclosure web site (www.adviserinfo.sec.gov).
The TABR Model Portfolios are allocated in a range of investments according to TABR’s proprietary investment strategies. TABR’s proprietary investment strategies are allocated amongst individual stocks, bonds, mutual funds, ETFs and other instruments with a view towards income and/or capital appreciation depending on the specific allocation employed by each Model Portfolio. TABR tracks the performance of each Model Portfolio in an actual account that is charged TABR’s investment management fees in the exact manner as would an actual client account. Therefore the performance shown is net of TABR’s investment management fees, and also reflect the deduction of transaction and custodial charges, if any.
Comparison of the TABR Model Portfolios to the Vanguard Total Stock Index Fund, the Vanguard Total International Stock Fund, the Vanguard Total Bond Index Fund and the S&P 500 Index is for illustrative purposes only and the volatility of the indices used for comparison may be materially different from the volatility of the TABR Model Portfolios due to varying degrees of diversification and/or other factors.
Past performance of the TABR Model Portfolios may not be indicative of future results and the performance of a specific individual client account may vary substantially from the composite results above in part because client accounts may be allocated among several portfolios. Different types of investments involve varying degrees of risk, and there can be no assurance that any specific investment will be profitable
For additional information about TABR, including fees and services, send for our disclosure statement as set forth on Form ADV from us using the contact information herein. Please read the disclosure statement carefully before you invest or send money.
A list of all recommendations made by TABR within the immediately preceding one year is available upon request at no charge. The sample client experiences described herein are included for illustrative purposes and there can be no assurance that TABR will be able to achieve similar results in comparable situations. No portion of this writing is to be interpreted as a testimonial or endorsement of TABR’s investment advisory services and it is not known whether the clients referenced approve of TABR or its services.