The Process (Thanks Nick!), Global Divergences, And A Little Bragging
I don’t know if Nick Saban, the head football coach at the University of Alabama, is the greatest college football coach ever, but he’s certainly one of the best. He is well known for not focusing on results, but rather on what he calls The Process.
There’s no mention of titles. Instead, his message has been that the way to win a championship is to concentrate on what you’re doing today, and try to build on that tomorrow.
What has this got to do with successful investing? Quite a bit, actually. I thought I’d use this opportunity to summarize a refresher course on the Process we use at TABR Capital Management, and to show some recent real-time examples of how that has played out in the portfolio management of client portfolios.
We’ll also have an update on the growing divergence between domestic and international stocks, along with a pretty cool story about someone near and dear to us. Read on.
TABR’s Investing Process
Joe Pendry has been on Coach Saban’s staff since 2007, and in an online story about Alabama football, he summed up The Process they use in a number of comments.
“It kind of reminds me what we do every day. You follow directions, you have no problems. All of those directions are written out: Step 1, Step 2…..You follow them, you put together a bike without any problem. But if you try to go from Step 1 to Step 4, then usually you have to go all the way back.
“That’s what we try to get across to the players. You can’t get from A to Z by passing B.”
The Process is about doing the little things every day, rather than spectacular outcomes, and it isn’t just about football.
“It’s kids being disciplined enough to go to class, go to study hall, to take advantage of tutors,” Pendry said. “To go to offseason programs. Go through spring practice. Every step of the way taking care of the little things.”
How This Relates to What We Do At TABR
Though financial planning is a significant part of what we do for clients, the following is more directed at our money management philosophy, and how we go about implementing it for clients. Our process, in other words.
First, let me remind you what the heck TABR stands for. Technical Analysis Based Risk-Management. Though fundamental indicators and analysis are quite important, they are terrible for timing and risk management, so if you told me I could only play the piano with one hand, it would be with technical analysis and indicators.
We use models to guide our allocation decisions, and though they consist of technical indicators and some fundamental ones, the process is probably more quantitative than technical. The common theme from them all is that they are rules-based, systematic and unemotional.
Beating the market indexes is not our primary goal. Rather, that objective is achieving our clients’ goals with much less downside volatility. Why is that important? Because the decisions you make when you are relaxed are always better than those you make when you are under stress.
For the vast majority of investors, buying and holding stocks and bonds and sitting tight through their worst down cycles (-55% for stocks and -30% for high yield bonds) is not something that most humans can handle without panicking. And all it takes is one bad decision to undo years of hard investing work to derail one’s financial goals.
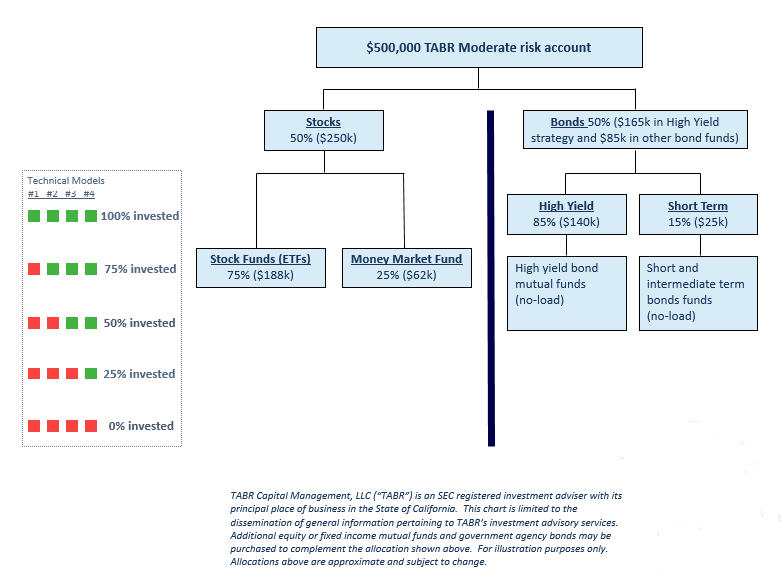
Below is a graphic that my partner, Steve Medland, created to illustrate the process we use at TABR. This illustration is for a Moderate Risk account. At present, our allocation for Moderate accounts is 50% to stocks and 50% to bonds. But, it does not stop there. Within each category, we have models that trigger our allocation decisions.
In the illustration below, $250,000 is devoted to stock exposure. We then consult our stock market risk models to determine how much of that $250,000 is invested in stock funds at any given time. In the example below, it shows the use of 4 models. When 3 of the 4 are positive, that dictates 75% exposure, so of the $250,000, about $188,000 would be invested in broad-based stock ETFs (exchange traded funds), and the rest would remain in a money market fund earning interest (at present, about 1.84%).
In practice, we are currently using 8 models, but the premise is the same. We’re actually 50% invested in real-time right now, but we were 100% invested from mid-October to late January, and when all models are negative, we can and will go to 100% cash. The models are not perfect (which is why we use several of them for stocks, instead of just one), but you can see they are dynamic and adapt to market conditions, and this is how we manage downside risk, which will eventually come around again.
Besides having the knowledge and wisdom to put the right models together, perhaps the most important part of the Process is to have the discipline to simply follow the models. This is one of the reasons clients hire us. We’re going to follow our process, because we know that it works over time, and we’re not going to allow you to panic.
On the bond, or fixed income side, we allocate between 60% and 65% of the bond allocation to high yield corporate bond funds. This is the riskiest part of the bond market, but also the most rewarding. The key is knowing when to have exposure, and knowing when to have very little exposure.
Though it has only happened once, high yield bond funds dropped over -30% in the 2008 financial crisis. That would easily be enough to make most bond investors panic, but the risk model we use for this area has never lost more than -7% in hypothetical testing back to 1980 and in real-time use since 1988.
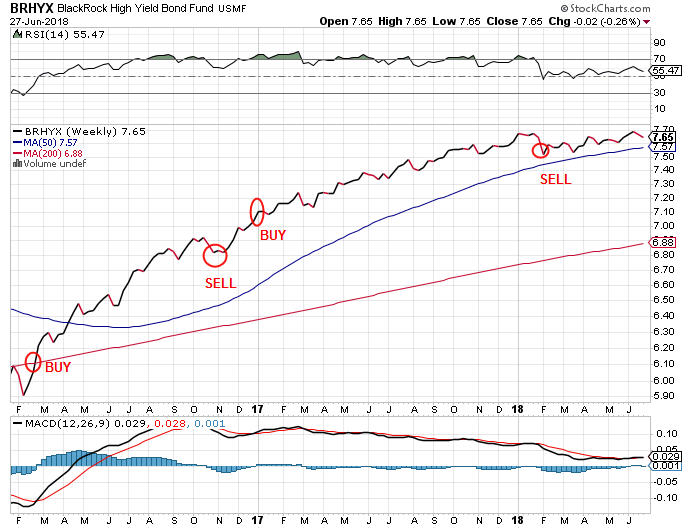
When our model is in a positive mode, as it was from early January 2017 to early February 2018 (see chart below, courtesy of www.stockcharts.com), we typically have 90% of this allocation invested in a variety of high yield funds, with the rest in short term bond funds. When a SELL signal is registered from our model, those allocations are simply reversed.
We’ve illustrated this concept on the chart, which is of the Blackrock High Yield Fund. There have been two trades in the past 2 1/2 years, and at present, our model has been on a SELL since early February. Since then, prices have gone sideways. Sometimes, we SELL and prices go higher, and we have to BUY back higher. That happened in November of 2016, as you can see on the chart. It is part of the Process.
The rest of our bond allocations are divided between PIMCO Income Fund, a multi-sector fund with an excellent track record, the Sierra Strategic Income Fund and the PowerShares 2024 Bullet Shares Investment Grade Corporate Fund. We do use a risk model on the PIMCO fund, but it has not triggered signals very often, the last one being a buy signal in March of 2016.
I realize that a lot of investors may be worried about rising interest rates, and what that might do to bond funds (higher yields = lower bond prices). We’re not worried at all, because we have the tools to deal with such an environment. Though we don’t know where rates are going, we’re rooting for higher yields and therefore lower prices, because it’s the only way we’re going to get to a place which offers better returns for the future.
I hope the above gives you a better understanding of our Process. Next month, we’ll follow up to this commentary and talk about the methodology we use for Selection. In other words, how do we determine what to own for our stock market exposure?
Global Divergences May Be A Problem
Since the stock market low in early February, when the S&P 500 concluded a -10% drop to the 2580 closing level, the index has been encountering resistance on rallies in the 2780 zone, which is still substantially below its peak of 2870 made in late January.
In the last two weeks, though, the NASDAQ and small cap indexes have made new all-time highs, while large cap indexes are languishing and international markets are actually losing money. The NASDAQ is dominated by technology names, and their growing concentration is beginning to feel like the late 1999-2000 era, which ended very badly. Look at the disparity of broad market indexes below, with the data through June 26 (year-to-date figures):
S&P Small Cap 600 Growth +12.79%
Nasdaq 100 Index (QQQ) +10.95%
Vanguard 500 Index Fund +2.73%
New York Composite Index -2.32%
Vanguard Total International Fund -3.79%
IShares MSCI Emerging Mkt Index -6.78%
Stock market uptrends are more healthy when most markets are participating, but that is not happening right now, and it may be the beginning of the end of this bull market. Below is a tape composite from Ned Davis Research that uses trend and momentum indicators from 48 countries. Last week, it moved into its Bearish zone. Can U.S. markets stay afloat when the rest of the world is headed south? Only for so long.

ASAP Winners
As many of you may be aware, I’m heavily involved in the Finance Department at Cal State Fullerton, serving as an Equity Board member for their Applied Security Analysis Program (ASAP) for the past seven years. About 20 years ago, as part of our budgeted charitable giving, my wife and I established scholarships at our respective high schools and at Cal State Fullerton to give back to students in targeted areas.
Three years ago, given my growing involvement with the University, I decided to restrict my Finance Department scholarships to ASAP class members to further enhance being part of the class.
This year’s winners (announced in early May at final presentations) each receive a stipend of $2,250, and were Alia Leiyn and Ryan Lew, shown below with me.

Both Alia and Ryan are in the process of studying for their CFA Level 1 exam which they will take in December, while Ryan has also started in a new position at State Street working as an investment operations analyst in Irvine while also being involved as a member of the CFA Orange County Society. I am very humbled and blessed to be able to help the next ones in line. Congratulations to Alia and Ryan.
A Proud Dad And Mom
Friday, June 8 was “promotion” day at our daughter’s middle school, Heritage Oak Private Elementary in Yorba Linda. So, my wife Michelle and I were dutifully at school that morning to watch Caroline “graduate” along with her classmates, to the 8th grade. A variety of awards were announced and handed out, and at the end, the middle school director, Mrs. Latrese Jackson, had a final presentation. Side note–we had no idea this was coming.
Here’s what she said: “Our 7th Grade Humanitarian is someone who exemplifies the six pillars of character on a regular basis. She is a responsible student who strives to do her very best in every subject. A marvelous example for her peers, she is a hard worker, good listener, and a poised young woman. This young lady loves to share her time by helping others. She can often be found in a teacher’s classroom grading assignments or preparing materials, aiding staff members with projects, guiding new and prospective parents on tours, and helping peers and other students wherever there is a need.
Outside of school, she is an active member of her Girl Scout troop and participates in various community service projects. She has served many hours in local kitchens, preparing and serving those who are less fortunate. Her summers are spent as a junior camp counselor for younger Girl Scouts, and her weekends are spent participating in community outreach programs and fundraising events. This young lady even created a public service announcement about hacking and spamming to educate others. Caroline Kargenian is dedicated to helping others in any capacity, and is most deserving of this Humanitarian award today.”

Holy cow. I am so lucky to be her Dad.
Material Of A Less Serious Nature
A 75-year-old lady decided to give herself a big treat for her birthday by staying overnight in a really nice hotel. When she checked out the next morning, the desk clerk handed her a bill for $250. She demanded to know why the charge was so high.
“I agree it’s a nice hotel, but the rooms aren’t worth $250 for just an overnight stay. I didn’t even have breakfast.”
The clerk told her that $250 is the ‘standard rate’, and breakfast had been included had she wanted it. She insisted on speaking to the Manager. The Manager appeared, and forewarned by the desk clerk, announced: “This hotel has an Olympic-sized pool and a huge conference center which are available for use.” “But I didn’t use them,” she said. “Well, they are here, and you could have,” explained the Manager.
He went on to explain that she could also have seen one of the in-hotel shows for which they were so famous. “We have the best entertainers from the world performing here,” the Manager said. “But I didn’t go to any of those shows,” she said. “Well, we have them, and you could have,” the Manager replied.
No matter what amenity the Manager mentioned, she replied, “But I didn’t use it!” and the Manager countered with his standard response. After several minutes’ discussion, and with the manager still unmoved, she decided to pay, wrote a check, and gave it to him. The Manager was surprised when he looked at the check.
“But, madam, this check is for $50,” he said. “That’s correct. I charged you $200 for sleeping with me,” she replied. “But I didn’t!” exclaimed the very surprised Manager.
“Well, too bad, I was here, and you could have.”
Summer officially kicked in last week. Here’s wishing you sunny days, time with friends and family, and lots of baseball. Soccer is not my thing, but I know the World Cup is a big deal to many of you, so enjoy your passion! We sincerely appreciate the trust and confidence you have in all of us at TABR.
Thank you,

Bob Kargenian, CMT
President
TABR Capital Management, LLC (“TABR”) is an SEC registered investment advisor with its principal place of business in the state of California. TABR and its representatives are in compliance with the current notice filing and registration requirements imposed upon registered investment advisors by those states in which TABR maintains clients. TABR may only transact business in those states in which it is notice filed, or qualifies for an exemption or exclusion from notice filing requirements.
This newsletter is limited to the dissemination of general information pertaining to our investment advisory/management services. Any subsequent, direct communication by TABR with a prospective client shall be conducted by a representative that is either registered or qualifies for an exemption or exclusion from registration in the state where the prospective client resides. For information pertaining to the registration status of TABR, please contact TABR or refer to the Investment Advisor Disclosure web site (www.adviserinfo.sec.gov).
The TABR Model Portfolios are allocated in a range of investments according to TABR’s proprietary investment strategies. TABR’s proprietary investment strategies are allocated amongst individual stocks, bonds, mutual funds, ETFs and other instruments with a view towards income and/or capital appreciation depending on the specific allocation employed by each Model Portfolio. TABR tracks the performance of each Model Portfolio in an actual account that is charged TABR’s investment management fees in the exact manner as would an actual client account. Therefore the performance shown is net of TABR’s investment management fees, and also reflect the deduction of transaction and custodial charges, if any.
Comparison of the TABR Model Portfolios to the Vanguard Total Stock Index Fund, the Vanguard Total International Stock Fund and the Vanguard Total Bond Index Fund is for illustrative purposes only and the volatility of the indices used for comparison may be materially different from the volatility of the TABR Model Portfolios due to varying degrees of diversification and/or other factors.
Past performance of the TABR Model Portfolios may not be indicative of future results and the performance of a specific individual client account may vary substantially from the composite results above in part because client accounts may be allocated among several portfolios. Different types of investments involve varying degrees of risk, and there can be no assurance that any specific investment will be profitable.
The TABR Dividend Strategy presented herein represents back-tested performance results. TABR did not offer the Dividend Strategy as an investment strategy for actual client accounts until September/October 2014. Back-tested performance results are provided solely for informational purposes and are not to be considered investment advice. These figures are hypothetical, prepared with the benefit of hindsight, and have inherent limitations as to their use and relevance. For example, they ignore certain factors such as trade timing, security liquidity, and the fact that economic and market conditions in the future may differ significantly from those in the past. Back-tested performance results reflect prices that are fully adjusted for dividends and other such distributions. The strategy may involve above average portfolio turnover which could negatively impact upon the net after-tax gain experienced by an individual client. Past performance is no indication or guarantee of future results and there can be no assurance the strategy will achieve results similar to those depicted herein.
Inverse ETFs
An investment in an Inverse ETF involves risk, including loss of investment. Inverse ETFs or “short funds” track an index or benchmark and seek to deliver returns that are the opposite of the returns of the index or benchmark. If an index goes up, then the inverse ETF goes down, and vice versa. Inverse ETFs are a means to profit from and hedge exposure to a downward moving market.
Inverse ETF shareholders are subject to the risks stemming from an upward market, as inverse ETFs are designed to benefit from a downward market. Most inverse ETFs reset daily and are designed to achieve their stated objectives on a daily basis. The performance over longer periods of time, including weeks or months, can differ significantly from the underlying benchmark or index. Therefore, inverse ETFs may pose a risk of loss for buy-and-hold investors with intermediate or long-term horizons and significant losses are possible even if the long-term performance of an index or benchmark shows a loss or gain. Inverse ETFs may be less tax-efficient than traditional ETFs because daily resets can cause the inverse ETF to realize significant short-term capital gains that may not be offset by a loss.
For additional information about TABR, including fees and services, send for our disclosure statement as set forth on Form ADV from us using the contact information herein. Please read the disclosure statement carefully before you invest or send money.
A list of all recommendations made by TABR within the immediately preceding one year is available upon request at no charge. The sample client experiences described herein are included for illustrative purposes and there can be no assurance that TABR will be able to achieve similar results in comparable situations. No portion of this writing is to be interpreted as a testimonial or endorsement of TABR’s investment advisory services and it is not known whether the clients referenced approve of TABR or its services.