The Top Heavy US Market, And Should Private Equity Be Part Of Your Allocations?
There has been concern in recent years over the concentration of just a few companies in the S&P 500, notably the top 10, where their price performance and earnings growth have dominated. This has masked relative weakness in other parts of the market, from midcaps and small stocks to foreign equities. In this update, we’ll take a look under the hood at these companies, from both a technical perspective and some fundamental metrics, and attempt to assess the implications.
In the institutional market, private equity has been the rage for many years, supposedly generating substantial alpha for investors. The likes of Harvard, Yale, Notre Dame and Princeton have anywhere from 39% to 48% of their endowments in private equity, according to a recent Barron’s article. Now, the likes of Apollo are joining Blackstone and Vanguard to bring private equity to the masses, the retail investor. That’s normally a sign to sell, not buy. We’ll examine if there’s a better way to get exposure, should one be so inclined.
How Healthy Are The Top Stocks In The S&P 500?
At present, the top ten stocks in the S&P Index represent nearly 36% of the index. In order of their weighting, they are Microsoft, Nvidia, Apple, Amazon, Meta (the old Facebook), Broadcom, Alphabet Class A (Google), Tesla, Berkshire Hathaway and Alphabet Class C. In essence, it’s really 9 companies, as the only difference between Alphabet Class A and C shares are voting rights. If you combine their weights, Alphabet is the 5th largest company in the index.
In terms of weight, the two largest companies are Microsoft and Nvidia, both at nearly 7%, while Berkshire Hathaway is the “smallest” at 1.75%. Normally, when just a few stocks hold up the market, it’s considered a bad sign. Certainly, in recent years, even going back to the bottom of the market in 2009, large company stocks have substantially outperformed small and midcap stocks, along with international equities. Can this go on forever? Probably not. There’s something called the Law Of Large Numbers. But, one cannot also ignore the significant earnings growth these companies have provided, in comparison with the index.
Below, I’ve put together a table showing various metrics of the stocks, including the normalized price/earnings ratio from Morningstar, the price/sales ratio, the current technical rank from Dorsey Wright, along with the 6-year compound growth rate of revenues, earnings and stock price appreciation, which includes dividends where applicable. The data is for the time period of 12/31/2018 to 12/31/2024. Regarding the technical rank, note that rank numbers are from 0 to 5, with 5 being the best. At present, 4 of the 9 have the highest rating, with Apple rated the worst. The three stocks with the worst year-to-date returns, through June 13, all have the worst technical ranks.
A couple of things. The 6-year numbers for earnings, sales and price are compound growth. I couldn’t technically compute a growth rate for Tesla, since Tesla actually lost money in the calendar year of 2018, and didn’t turn profitable until 2020. In the last six years, the overall S&P 500 Index has grown earnings at a 12.2% compound rate, while an equal weight of the 8 companies below, excluding Tesla, have compounded growth at just over 22% per year. That would be higher when including Tesla, where earnings have gone from 0 to about $2.05 per share. Plus, it includes Broadcom, whose earnings growth has only been 6.6% compounded through 2024. That stock, though, has been on a tear, probably because earnings are expected to grow from $1.29 in 2024 to $4.50 this year.
| Stock | Technical Rank | Normalized P/E | Price/Sales Ratio | 6 Year Earnings Growth | 6 Year Sales Growth | 6 Year Price Return | YTD Price Return |
| Microsoft | 5 | 36.79 | 13.14 | 20.3% | 14.8% | 28.0% | 2.21% |
| Nvidia | 5 | 44.49 | 23.64 | 49.4 | 61.2 | 85.3 | 5.73 |
| Broadcom | 5 | 42.58 | 21.05 | 6.6 | 16.3 | 48.9 | 7.53 |
| Berkshire Hathaway | 5 | 22.95 | 2.53 | 13.9 | 9.8 | 14.2 | 7.56 |
| Amazon | 4 | 34.38 | 3.51 | 32.7 | 18.3 | 19.5 | -3.32 |
| Meta | 4 | 26.59 | 10.44 | 21.1 | 19.7 | 28.4 | 16.72 |
| Alphabet (Google) | 3 | 21.23 | 5.99 | 22.9 | 16.9 | 24.3 | -7.43 |
| Tesla | 3 | 135.82 | 11.92 | n/m | 28.7 | 62.1 | -19.45 |
| Apple | 2 | 27.71 | 7.46 | 12.6 | 6.7 | 37.1 | -21.35 |
The first part of the narrative is that on average, the stocks are growing earnings at a much faster clip than the overall index. At present, the trailing price/earnings ratio for the S&P 500 is 27.16, while for the 8 stocks excluding Tesla, the normalized P/E is 32.09. I’m not sure what to do with Tesla, since when you include their P/E, the average P/E jumps to 43.6. It’s arguable that a modest premium to the market should be justified for many of the companies because of their growth. When it comes to price return, the gap gets even wider. In the six years ending 2024, the S&P 500 with dividends reinvested has compounded at 17% per year, while an equal-weighted version of the 9 companies has compounded at 38.6%. In other words, price has expanded at over double the rate of the index, and at about 75% greater than the earnings of the companies. In other words, price/earnings multiples have expanded.
How high can they go? That’s hard to know, but history suggests that growth rates of this magnitude are difficult, if not impossible, to sustain. Below are charts of one of the best stocks, Nvidia, followed by the worst stock, Apple. The charts are courtesy of www.stockcharts.com.
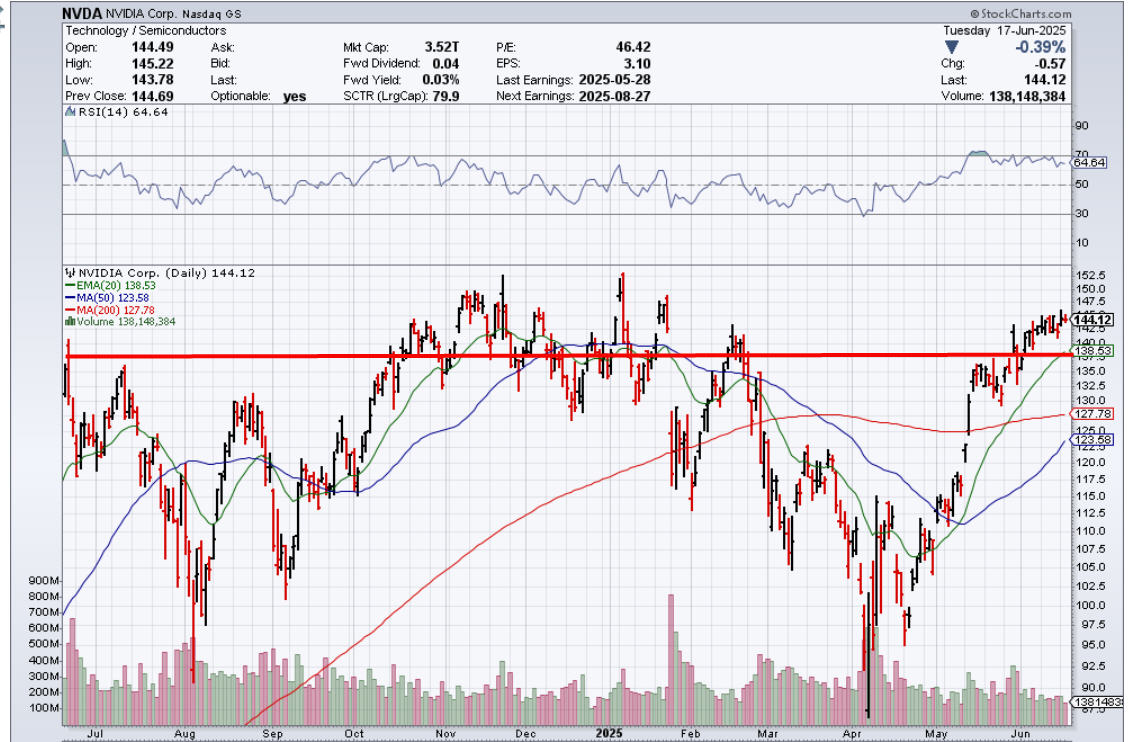
Nvidia began the year at the 134 level, plunged almost -30% to 94 with the tariff news, and has since rebounded 53%. The stock trades at over 23 times sales, and historical data on companies trading at price/sales multiples over 15 is not favorable. Even at today’s elevated levels, earnings are expected to grow 51% in 2025, with revenues expected to climb nearly 44%. The company is Wall Street’s darling, until it isn’t, but thus far, they have mostly been delivering results.
In contrast, Apple feels like a rotten batch of, well, apples. Revenues have compounded at under 7% per annum the last 6 years, and are expected to grow only 4% in 2025. Perhaps Apple’s stock performance is finally reflecting that reality, with the stock down nearly -20% year-to-date. See below.
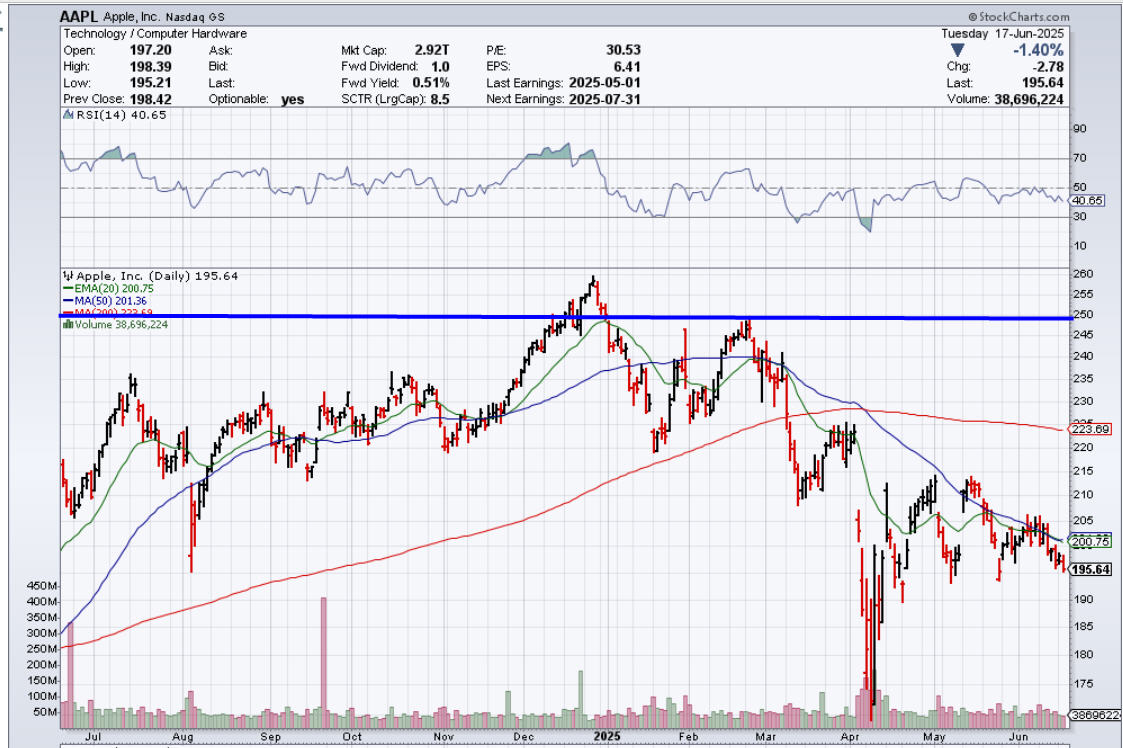
The stock began the year at 250, near it’s all-time high, and plunged to 172 with the tariff news. But unlike Nvidia, the stock has only recovered 13% off its low. Though he certainly didn’t sell at the highs, given that Apple stock peaked in December, it should be noted that in the first six months plus of 2024, Warren Buffett sold $80 billion of his position in Apple. It was his largest position. He’s not perfect, but he seems to have been on to something, and still is sitting on over $300 billion of cash. He also doesn’t seem ready to buy anything. In response to the near -20 drop in the S&P 500 which ended in April, his response in a recent article was something of the sorts like, “That was nothing. Investors haven’t seen a bear market in quite some time.”
In general, large cap stocks in the U.S. are overpriced on a historical basis, which is reflected in much lower than average future returns, as depicted in our custom chart of 5-year normalized earnings, as produced by our friends at Ned Davis Research (www.ndr.com). This is based on the concept developed by economist Robert Shiller, who is credited with creating the CAPE ratio (cyclically adjusted price earnings), where one uses 10 years of earnings and smoothes them, rather than just one year of trailing or future earnings. Shiller uses 10 years, but we also look at a 5-year CAPE, which is favored by our friend Doug Ramsay at Leuthold Group. That chart is below.
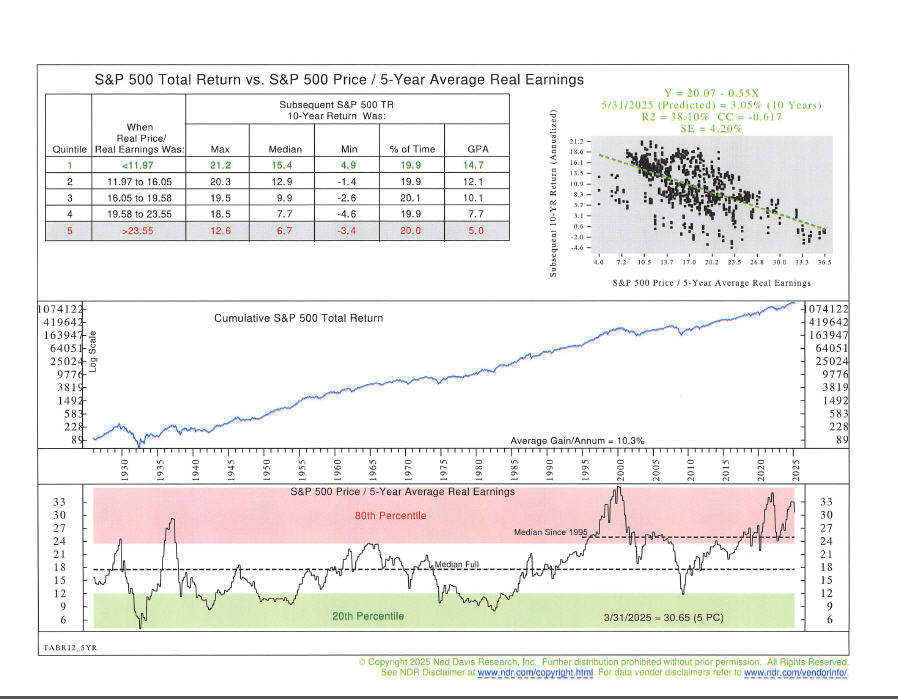
With a current reading just over 30, this valuation indicator sits at its 3rd highest level in history, going back nearly 100 years. It would have to fall some -40% to get back to the median of the entire time period, around the 18 level. But many analysts argue, perhaps with a good point, that price/earnings ratios have expanded in recent years, mainly due to large growth companies being in service and technology industries rather than manufacturing, like in the past. To counter this argument, we had NDR produce a median since 1995, as you can see in the bottom clip. That level is still at the approximate 25 level, which is -18% below current readings.
We are a believer in mean reversion in markets, but nobody can know when that will happen. The above historical data suggests low, single-digit compound returns in the 3-5% range for the S&P 500 for the next 10 years. Other areas of the stock market, including small and midcap stocks and foreign stocks, are priced to do better, as are various parts of the bond market. Though it’s easy to look back 10 years and think that the best thing would have simply to have been 100% invested in large company stocks, that’s called Hindsight Capital Management. Diversification will likely be more valuable in coming years, until large company stocks in whole are priced more reasonably.
The Private Equity Conundrum. Should You Invest?
As mentioned in our lead paragraphs, Wall Street is attempting to bring private equity investing to the retail public. This is an area that has typically been only available to large institutions and very high net-worth investors, who qualify as “accredited investors.”
What exactly is private equity investing? That’s the process of acquiring and managing privately held companies, or in some cases taking public companies private, with the goal of increasing their value and ultimately selling them for profit. This often involves streamlining operations, cutting costs and increasing leverage. There’s usually three types of specialties—buyouts of mature companies, investing for growth in promising industries and startups, or venture capital.
It’s a high risk, high return strategy that is illiquid, is long term in nature and requires active management. Leverage is normally employed, and fees tend to be quite high. There are no “indexes” to invest in, that can replicate what private equity can do. It’s not like the S&P 500, or other stock indexes. Performance, much like with hedge funds, is solely dependent on the skills of the manager.
As a result, some studies that go back 20 to 25 years suggest that private equity has outperformed the S&P 500, and added significant value, which is perhaps why university endowments, and very large pension funds, such as CalSTRS, CalPERS, General Motors and many others allocate significant percentages of their funds to this area.
Other studies suggest quite the opposite, especially in the last 15 years or so, as the S&P has compounded at some 16% per annum, where you could have owned it in a mutual fund and likely paid less than 20 basis points per annum to do so. One of the major problems I have with private equity performance is the methodology. Many sponsors use the internal rate of return, which is a flawed methodology.
It’s not nearly as simple as saying, “Hey, I gave you $250,000 six years ago, and today, you guys sold the companies and gave me back $450,000, so I made 80% in six years, net.” No, there are capital calls and return of capital, and that makes apples to apples comparisons quite difficult. Then throw in leverage. I mean, really, if a private equity fund is leveraged 135%, meaning you’re investing $1.35 for every $1 raised, well, all things being equal, you SHOULD beat the market by 35% just to be equivalent given the risk. That tends to be downplayed, though.
As noted above, now, some of the biggest players in the space, Blackstone and Apollo, are teaming up with Vanguard to create a more liquid, retail product that can be peddled to ordinary investors. Maybe things won’t be as bad as I think, but historically, product innovations such as this usually come at the end of a cycle, or at their peak in popularity, not at the beginning. So, count me as a skeptic.
Having said that, should you really want to go down this road, I have a better idea. Forget investing in funds, or private deals, where one needs some serious math skills and knowledge to understand if the deal is really sound (or you have an advisor with that talent). Instead, just invest directly in the stocks of the private equity firms themselves.
Getting the idea from a couple of articles I read a year ago, I researched the performance of the five prominent publicly traded private equity/alternative asset firms, from their inception as public companies, and compared that performance to that of the S&P 500. What are you getting? Tremendous diversification and skill, with skin in the game.
Carlyle manages $426 billion, KKR manages $552 billion, Apollo manages $650 billion, Ares manages $418 billion and Blackstone is at $1.04 trillion. When you’re a shareholder, now you’re on the same side of the table as management, who is investing in these deals. You don’t have to do any due diligence. And you don’t have to pay 1.40% annually in management fees, let alone incentive fees.
I wasn’t certain as to what I was going to find, but I had a suspicion, mainly that these firms in aggregate would do much better than the S&P 500. See below for the data.
| 2019 | 2020 | 2021 | 2022 | 2023 | Lifetime | VFINX | 2024 | 2025 ytd | |
| Blackstone | 96.39% | 19.76 | 107.12 | -40.01 | 82.76 | 14.4 | 9.3 | 35.07 | -19.65 |
| KKR | 51.58 | 41.14 | 85.79 | -36.98 | 80.49 | 21.6 | 13.5 | 79.64 | -17.73 |
| Apollo | 106.54 | 7.98 | 53.25 | -9.58 | 49.44 | 22.1 | 12.5 | 79.88 | -19.49 |
| Carlyle | 116.75 | 1.59 | 78.49 | -43.79 | 40.2 | 11.5 | 13.1 | 28.03 | -7.21 |
| Ares | 110.14 | 37.37 | 77.75 | -12.74 | 79.5 | 26.8 | 12.0 | 52.68 | -5.18 |
| Avg Return | 96.28 | 21.56 | 80.48 | -28.62 | 66.47 | n/a | n/a | 55.06 | -13.85 |
| S&P Total Return | 31.49 | 18.4 | 28.71 | -18.11 | 26.29 | n/a | n/a | 24.84 | 2.30 |
Let me disclose some additional information regarding the above, as the table is not complete due to sizing limitations. The lifetime compound annual returns are for each company from their inception date as a public company through 12-31-2023, with comparisons to the S&P 500 Index for that same exact period. I have not updated my data to include the 2024 results, but I wanted to list those as well, plus what has happened thus far in 2025.
For reference, Blackstone went public on 6-22-07, KKR on 7-15-2010, Apollo Global on 3-30-2011, Carlyle Group on 5-3-2012 and Ares Management on 5-2-2014. Of the five companies I researched, only Carlyle lagged the S&P 500, by 1.6% annually. The other four beat the index ranging from over 500 basis points per annum to over 1400 basis points per annum. I completed my study in the middle of 2024 and didn’t have the full year results at that time, but one can see that in 2024, an equal investment in all five companies averaged a 55% gain vs just under 25% for the S&P 500. Meanwhile, there’s a big lag thus far in 2025.
A conclusion and an additional note. In this space, two other firms have gone public in the past five years, including Thoma Bravo and Texas Pacific Group, but I’ve not examined their performance yet. My conclusion is simply this. If you’re seriously interested in diversifying into this space, don’t waste your time with new Wall Street products. Just buy all five companies in equal amounts, and let them go, but dollar cost averaging would likely be a good idea. The stock prices can be very volatile, such as in 2022, this year, and also in 2015 when the average of the four lost -23.9%. Blackstone, which was much smaller in 2007 when it went public, declined -36% in the last six months of 2007 after going public, then was down another -67% in 2008.
Much like the past 16 years of 16% compound returns in the S&P 500, it’s unlikely the great alpha these companies have provided will continue either, but that doesn’t mean they won’t add value vs the index. It’s just that much like the companies above such as Apple and Nvidia, the larger they get, the harder it is to grow. There’s simply too much money chasing too few good deals.
I’m not ready to add this strategy to TABR’s tactical portfolios, but if (or perhaps when!) the S&P 500 goes down -30% or more in the next bear market, that would be an ideal time to put capital to work in this regard. Remember—deal making will never go away on Wall Street.
Portfolio Allocations
There have been no changes or trading in our tactical portfolios since May 5, when both our high yield bond risk model shifted into its BUY mode, and one of our stock market risk models also turned positive that day. Our tactical equity exposure remains at 60%, with two of our models still negative.
It feels as though the S&P 500 wants to make a new high above the February 19 level. There does not seem to be much, if any, stress in credit markets and the Fed met today with no change in the Fed Funds rate, with none likely until at least September.
With my perfect crystal ball (sic), I’m expecting decent market conditions until around mid-July, when trouble is likely to begin heading into August and September. Meanwhile, remember that with all of the ups, downs and ups so far, other than international stocks, which are up 14.77% ytd using the Vanguard Total International Stock Fund as a bogey, all other stock indexes, including the S&P 500, are lagging almost all areas of the bond market thus far.
The S&P 500 is up just 2.30% through June 17, lagging investment grade bonds such as the iShares 2027 Corporate Fund (IBDS), at 2.63%. Worse, small and midcap stocks are down -7.52% and -2.85%, respectively, using the S&P 600 Smallcap and S&P 400 Midcap. Unfortunately, any diversification into those areas has continued to harm portfolios.
Material Of A Less Serious Nature
Pete was walking down a street when he saw his buddy Mike driving a brand new Corvette. Mike pulled up to him with a big grin.
“Mike, where’d you get that car?”
“Susie gave it to me,” Mike replied.
“She gave it to you? I know she kinda had a thing for ya, but a new Vette?”
“Well, Pete, let me tell you what happened. We were driving out on a country road at 9 in the evening, in the middle of nowhere. Susie pulled off the road and headed into the woods. She parked the car, got out, threw off all her clothes and said, ‘Mike, take whatever you want.'”
“So, I took the car!”
“You’re a smart man, Pete. Them clothes never would have fit you.”
Well, summer is almost officially here according to the calendar, with school done, the weather warmer and baseball and beach outings in full mode. Two plus weeks ago, our son Adam and I got to go to Game 5 of the Western Conference Finals in Dallas, with our Stars once again falling short of the Stanley Cup. Despite being bridesmaids once again (a not so subtle reminder from my wife, Michelle), the excitement of being in person at a playoff game is palpable, and should you be lucky to attend a game that goes to overtime, OMG.
So, other than markets and some R&R&R (that would be reading, rest and relaxation), my focus shifts to the Giants chasing the Evil Empire of the West, aka the Dodgers. And, check my glasses, but the Angels are only 3 games out of a wild card spot in mid-June. What’s next? The Apocalypse?
Thank you for your continued trust and confidence in all of us at TABR.
Sincerely,

Bob Kargenian, CMT
President
TABR Capital Management
TABR Capital Management, LLC (“TABR”) is an SEC registered investment advisor with its principal place of business in the state of California. TABR and its representatives are in compliance with the current notice filing and registration requirements imposed upon registered investment advisors by those states in which TABR maintains clients. TABR may only transact business in those states in which it is notice filed, or qualifies for an exemption or exclusion from notice filing requirements.
This newsletter is limited to the dissemination of general information pertaining to our investment advisory/management services. Any subsequent, direct communication by TABR with a prospective client shall be conducted by a representative that is either registered or qualifies for an exemption or exclusion from registration in the state where the prospective client resides. For information pertaining to the registration status of TABR, please contact TABR or refer to the Investment Advisor Disclosure web site (www.adviserinfo.sec.gov).
The TABR Model Portfolios are allocated in a range of investments according to TABR’s proprietary investment strategies. TABR’s proprietary investment strategies are allocated amongst individual stocks, bonds, mutual funds, ETFs and other instruments with a view towards income and/or capital appreciation depending on the specific allocation employed by each Model Portfolio. TABR tracks the performance of each Model Portfolio in an actual account that is charged TABR’s investment management fees in the exact manner as would an actual client account. Therefore the performance shown is net of TABR’s investment management fees, and also reflect the deduction of transaction and custodial charges, if any.
Comparison of the TABR Model Portfolios to the Vanguard Total Stock Index Fund, the Vanguard Total International Stock Fund, the Vanguard Total Bond Index Fund and the S&P 500 Index is for illustrative purposes only and the volatility of the indices used for comparison may be materially different from the volatility of the TABR Model Portfolios due to varying degrees of diversification and/or other factors.
Past performance of the TABR Model Portfolios may not be indicative of future results and the performance of a specific individual client account may vary substantially from the composite results above in part because client accounts may be allocated among several portfolios. Different types of investments involve varying degrees of risk, and there can be no assurance that any specific investment will be profitable
For additional information about TABR, including fees and services, send for our disclosure statement as set forth on Form ADV from us using the contact information herein. Please read the disclosure statement carefully before you invest or send money.
A list of all recommendations made by TABR within the immediately preceding one year is available upon request at no charge. The sample client experiences described herein are included for illustrative purposes and there can be no assurance that TABR will be able to achieve similar results in comparable situations. No portion of this writing is to be interpreted as a testimonial or endorsement of TABR’s investment advisory services and it is not known whether the clients referenced approve of TABR or its services.