There’s No “High” In High Yield Spreads
I’ve been trading/investing in high yield corporate bond funds since the mid-1980s, after stumbling onto a formula that we still use a variation of today. It works. In the fixed income component of our clients’ diversified portfolios, junk bond funds make up 70% of the allocation (when we’re in risk on mode).
To those not familiar with our approach, you might think we’re nuts. The riskiest part of the bond market? Seventy percent of your bond allocation? I thought you guys at TABR were known for your conservative, risk-managed approach?
IF we were buy and holders, we WOULD be crazy. But we’re not. Given that yields are scarce everywhere, we thought we’d take a look at current high yield spreads and if they portend anything about the future.
We’ll also touch on the subject of campus health insurance, the new inherited IRA rules, the power of compounding, and a brief market update. Importantly, our stock market allocations are now holding 34% in cash/short term bonds, the first significant shift in over one year.
High Yield Spreads Are At Historical Lows
In July, the yield on the 10-year Treasury Note sat at 1.45%, which ranked in the 96th percentile over the last 30 years. Meaning, only 4% of the time was the yield lower. At the same time, the option-adjusted credit spread (OAS) on high yield bonds stood at 3.03%, a level which put it in the 92nd percentile over the last 25 years. Since then, the 10-year Treasury yield has risen to 1.61%, while the OAS has dropped further, now at 2.95%. The spread between the 10-year Treasury and the Bank of America U.S. High Yield Index is called the OAS, so when one adds 2.95% to 1.61%, you get 4.56%, which is the approximate yield on the U.S. High Yield Index. You can see the history of the Option-Adjusted Spread back to around 1996 in the chart below.
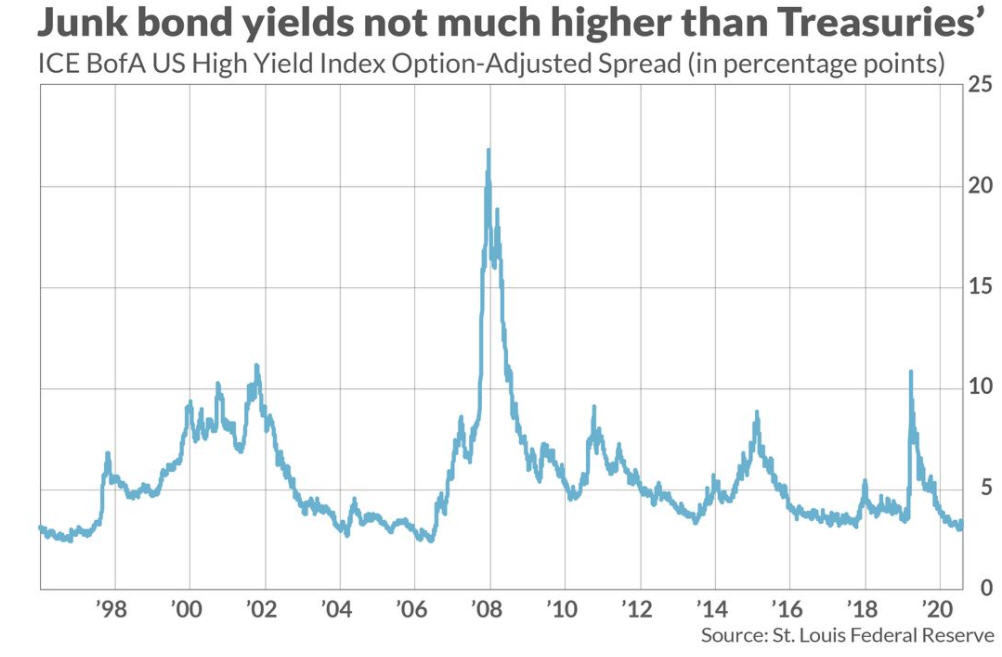
The spread has been in this zone several prior times in the last 25 years, first in 1996-97, then again from 2004-2007, briefly in 2013, and again from 2016-2018, before now. As one can see, sometimes spreads stay low for several years, but eventually, they’ve always spiked higher, usually to at least 800 to 900 basis points above Treasuries. For several years now, forecasters have been calling for higher yields (lower bond prices). For the most part, that hasn’t happened, but the conditions seem to be in place where it is happening. Going back to the COVID pandemic in March 2020, Treasury yields collapsed, with the 10-year Treasury Note reaching 0.49%. This coincided with a jump in the OAS to nearly 1100 basis points, as you can see with the spike on the chart above.
However, as the Federal Reserve Board stepped into the bond market in an unprecedented manner, by year-end, there was calm in the bond market, and Treasuries rebounded to 0.91%. Yields have risen further in 2021, currently at 1.61%, while high yield spreads are near historical lows, under 300 basis points. As the economy slowly strengthens, there is more pressure on the Fed to stop supporting the market, where they have been purchasing $120 billion of bonds per month. They are likely to begin withdrawing this support starting in November. It’s possible the bond market is already anticipating this event, with the premise being that without that demand, interest rates will need to rise. Given the inverse correlation between yields and bond prices (as yields go up, bond prices go down), over the years, a number of clients have expressed their fear as to what would happen to their bond funds should this process repeat itself. It’s likely more a matter of when it will repeat, not IF it will repeat.
Thanks to some research recently by our friends at the Leuthold Group, we thought we’d dig into this topic, and illustrate the impact of rising yields on high yield bond returns historically, as well as the impact of rising spreads, or a widening of the OAS. As you’ll see, the latter is a much riskier situation than the former.
Perhaps the two biggest factors inhibiting high yield bond returns would be rising interest rates, and rising default rates, given this is the riskiest part of the credit market. We’re all taught that as interest rates rise, bond prices go down. Look at the tables below, though, produced by Scott Opsal at the Leuthold Group.

The table shows periods over the last 25 years when yields on the 10-year Treasury were either rising or falling. You have a starting yield, an ending yield and the change in the rate. The Index Return column represents the total return during the cycle, as measured by the Bloomberg Barclays High Yield Corporate Index. Since 1996, there have been 8 periods of rising rates (top clip), and 8 periods of falling rates (bottom clip). As you might expect, the Index gained on average over 8.1% during falling rate periods, but I should note two of the periods sustained large losses (-8.7% and -17.8%), both of which were associated with bear markets in stocks. High yield bonds are highly correlated with the stock market, so this is no surprise.
What may surprise you are the outcomes during rising rate periods. The top clip shows average gains of 11.5%, with only one minor loss of -2.4%. I thought that bond prices went down when interest rates go up? They do, but when the yields on the bonds are high enough to compensate for this drag, one can still earn positive returns. That’s been happening in 2021 as well. The yield on the 10-year Treasury started the year at 0.91%, and currently sits at 1.58%, yet the average high yield bond fund is up about 4.4% year-to-date. In contrast, the Vanguard Total Bond Market Index Fund, representative of almost the entire investment grade portion of the bond market, is down -2.3%, much as you’d expect.
In fact, we calculated the total return for the Vanguard Total Bond Fund for each of the 8 rising interest rate periods shown above, and here’s what we found. In seven of the eight cases, the fund lost money, with average losses of -1.72% (certainly not a disaster as many would believe), with two of the losses greater than -4%. Given the compounding of reinvesting monthly dividends, even when rates rise, total returns can be enhanced if the rise takes place over a long period of time, rather than a rapid rise. In the example above, from June 2003 to June 2006, the yield increased from 3.13% to 5.25%, yet the Vanguard Total Bond Fund gained 3.72% during the period, because it took place over a three-year time span.
First conclusion—rising rates aren’t necessarily bad for high yield bonds. However, today’s average yield of about 4.5% is much lower than the starting yields of prior cycles, so there’s not the same margin of safety as in the past. As you’ll see below, a widening or narrowing of the OAS spread is much more important to total returns than changes in interest rates.
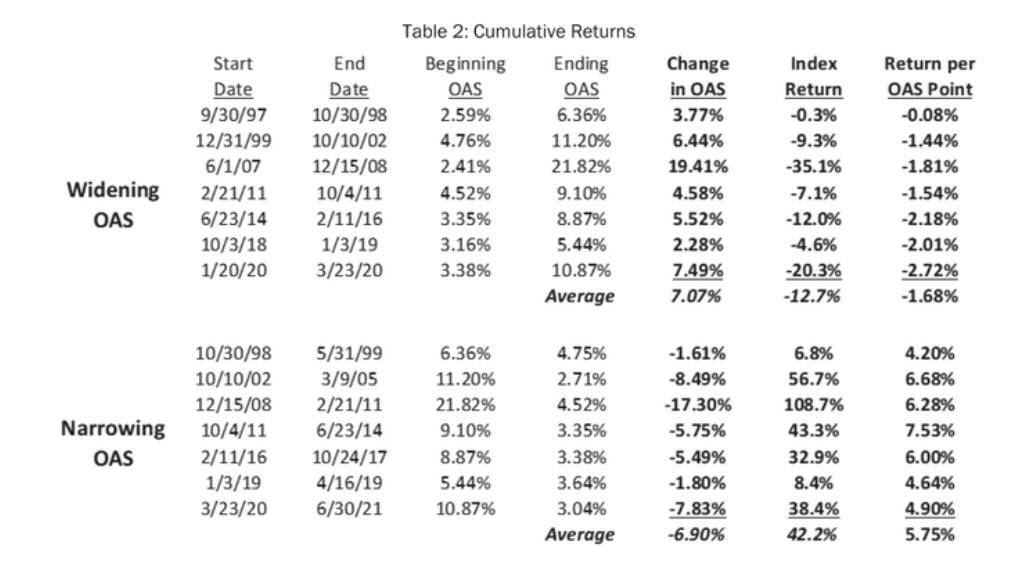
In the above data, there are seven cycles of either widening high yield spreads, or narrowing spreads. Narrowing spreads have provided a big boost to returns, with average gains of over 42%, and all seven instances resulting in positive returns. The exact opposite has occurred with widening spreads, with average losses of -12.7%, and all seven instances resulting in losses. Clearly, the biggest risk for an investor in high yield bond funds would be a significant widening of the OAS spread, such as took place in early 2020. For a buy and hold investor, there’s no doubt this is the biggest risk. It is when the biggest losses in this asset class have taken place, with the worst being a -35% drop concluding in 2008, and a -20% drop in early 2020. As mentioned above, though, we’re not buy and hold investors in this asset class. We use our high yield bond risk model to guide our allocations into and out of high yield bond funds. At present, we’ve had a fully invested position since November 2020, now nearly a year ago. At some point, our model will turn negative and we’ll temporarily move to short term bond funds with short durations.
We thought it would be insightful to go back in history and measure how TABR’s Bond Account strategy has performed during the periods of widening spreads, to illustrate the effect of risk management. This account was only active for five of the seven cycles, starting with the June 2007 time period. Here’s what we found. During the five cycles when our account was active, the buy and hold return for the Barclays High Yield Index was -15.82%, while the average return for TABR’s Bond Account was -5.23%. In other words, losses were less than one-third of the buy and hold return. The worst loss was in the 2007-08 period, when the account was down -14.8%, while the index was down -35% in comparison. I should also note that back in that time period, about 50% of our high yield allocation was in the Loomis Sayles Bond Fund, and we were using a wider stop loss provision. If we ever get another time period when high yield bonds drop by -35%, we expect our models will perform even better than they did in the 2007-08 period.
Second conclusion—widening OAS spreads are the biggest risk for high yield bond investors. With our tactical approach though, we don’t fear them. Rather, we should be rooting for them. After all, there’s no getting around the math. Would you rather own high yield bond funds starting with a 4.5% yield, or with an 8.5% yield? Maybe someday we’ll get back to the latter, but who knows when.
Campus Health Insurance—Should You, Or Shouldn’t You?
Many of you may be in the midst of having a son, daughter, or grandchild go away to college for the first time, whether it be in-state or out of state. With so many things being new, it can help to have someone give some guidance who’s already been through it. Our son, Adam, did this a number of years ago, trekking all the way across the country to New York University. We’re just beginning the college search for daughter Caroline, a junior at Orange Lutheran High School.
When you get that first invoice from the college for tuition, room and board, and more than likely, a meal plan of some sort, there’s also a line item for health insurance. The question becomes, should you purchase it? Since your children are likely already covered under their family’s health plan, I’d say the default answer is no, it’s a waste of money. But, there are exceptions. Ultimately, it depends on where the student is attending school, the family’s finances, and what kind of coverage is being offered. These plans typically run from $2000 to $4000 per school year, so it’s not a trivial amount of money.
This question reminds me of the common one I get every time I use a rental car, which is virtually every time I travel to visit clients or go to sporting events out of the area. Do you want to purchase our Hertz collision insurance? No, I don’t, not for $18 per day, when I already have auto insurance which will cover me. Granted, if you’re in an accident, it’s certainly cleaner when you’ve purchased the coverage, as you don’t have to get your auto insurance company involved. But, that convenience comes at a cost. It’s the same with campus health insurance.
There are several things to be aware of. If your family medical plan has a national network of preferred providers, that’s going to be a better situation for your child than if you have HMO coverage. Also, if your student is attending college out of state, it’s important to confirm with your provider that your student will have full coverage out of state. Finally, if you do decide to opt out of campus coverage, it’s vitally important that you and your student pay attention to billing deadlines. Most colleges will put this cost as a line item on your tuition invoice, and if you don’t want the coverage, you have to go through the process of opting out, which usually involves completing an online form and submitting it to the admissions office. Sounds pretty simple, doesn’t it? Try relying on your 18-year-old to do this, knowing that thousands of dollars are on the line. We learned this the hard way with Adam. He missed the deadline, then covered it up until we called admissions and found out he never submitted the waiver. I think it cost us around $900. We made him eat Chipotle for 30 days in a row.
By the way, for those of you who have 529 plans for your kids or grandchildren, please know that you may not use 529 plan assets to pay for college health insurance. If you do, you could be subject to taxes and penalties on the amounts withdrawn.
For additional context on this subject, I highly recommend the piece written by Ann Carrns of the New York Times, which was published in July. A link to her article is here.
The New Inherited IRA Rule—The “Stretch IRA” Is Gone
You may remember that back in 2019, Congress passed the SECURE Act, which had a variety of rule changes in it. I know. Bear with me here. It’s hard to feel secure about our leaders in government. In this case, they modified the rule in regards to inherited IRA accounts being passed on to non-spouse beneficiaries. The most common situation we encounter with this area is when a parent passes away, their spouse is gone, and so the IRA beneficiary is a child or their children. In the past, when this happened, the beneficiary would have the option to take RMD payments for the rest of their lives (required minimum distributions), using their life expectancy. In theory, a child could actually take the entire account and withdraw it all at once, but we would rarely suggest that course, unless the account balance was really minimal.
The nickname for this type of account was the “Stretch IRA,” because the beneficiary could literally stretch the payout over many years, maybe even 20 years or longer, depending on their longevity. In the SECURE Act, Congress effectively eliminated this possibility. Now, non-spouse beneficiaries must empty their accounts within 10 years. At present, there is some official confusion thanks to the IRS as to whether or not annual RMD payments must be made, but the intent of the law says NO. In other words, you can leave the account alone to grow, but in the 10th year, you’d have to empty it out completely. We have a number of clients in this situation, where they have lost a parent, and our current guidance is simply to do nothing and await official guidance which will eventually come from the IRS. They can take money out if they wish, but they don’t have to, based on all of the commentary we’ve been reading on this subject.
Social Security COLA Update
It was just announced by the Social Security Administration that the COLA (cost of living adjustment) for 2022, effective in January, will be 5.9%, the largest increase since 1982. This is mirroring inflation figures, which have been running at plus 5% for over 5 months now, and are expected to continue into next year. On a gross basis, if you are currently receiving $3000 per month, that benefit would go up by $2124 for the year, or about $177 per month. That’s actually pretty significant. Heck, one could go to the Summit House in Fullerton once a month for a nice dinner, as long as you don’t order a $50 bottle of wine. However, don’t go spending it all just yet. What’s unknown is also how much Medicare premiums will be going up, which will offset some of this increase.
I don’t need to tell you that inflation is here. Energy, food and housing have all risen significantly in the past year. We just drove to Fresno and back last weekend, and forgot to fill up gas in Tulare, so we stopped at the Laval Road exit about five miles south of the Grapevine, where there are like 7 places to eat and 4 gas stations. Well, we paid $5.14 per gallon for gas. Talk about a captive audience. The real question is whether or not inflation is here to stay at these elevated levels. Unfortunately, we don’t have those answers, and nobody else does either. There are no models that predict future inflation. However, based on what I’ve been reading about supply chain issues all over the world, my expectation is that we’re going to be dealing with these issues all the way into next summer. We’ll see.
The Power Of Compounding—A Great Illustration For A 25-Year Old
It’s part of life that we know a lot more when we’re 50 than when we’re 25. For those of you with children, I’m sure you might lament the fact that your kids don’t always listen to your wisdom. Maybe some of us forget that perhaps WE didn’t listen to our parents when we were 25. I’m currently preparing for the annual finance class that I teach to the Cal State Fullerton baseball and softball players, where I’m trying to disseminate as much information in 3 hours as I can cram in, hoping something might resonate. And, we’re still in the midst of guiding son Adam (27) and daughter Caroline (16).
Today, it seems like young people want to be rich NOW. At least that is the impression one can get from the media. I don’t know that to be true, though. There’s no doubt there are talented young people in their 20s doing amazing things. And some may hit upon significant incomes at an early age. But for most, it’s find a career and start the climb. One of the most basic things one can do is pay yourself first, and start saving at an early age, and never stop. This is where the math and power of compounding come in.
Not everybody will work for 40 years, and not everyone will have $35,000 in savings at the age of 25. But stay with me here. The table below is simply to illustrate the power of compounding, and I think it’s more powerful when you see it, rather than me just quoting you a couple of numbers.
| Age | Balance | Rate | Gain | New Sum |
| 25 | 35000 | 0.09 | 3150 | 38150 |
| 26 | 38150 | 0.09 | 3433.5 | 41583.5 |
| 27 | 41583.5 | 0.09 | 3742.515 | 45326.02 |
| 28 | 45326.02 | 0.09 | 4079.341 | 49405.36 |
| 29 | 49405.36 | 0.09 | 4446.482 | 53851.84 |
| 30 | 53851.84 | 0.09 | 4846.665 | 58698.5 |
| 31 | 58698.5 | 0.09 | 5282.865 | 63981.37 |
| 32 | 63981.37 | 0.09 | 5758.323 | 69739.69 |
| 33 | 69739.69 | 0.09 | 6276.572 | 76016.26 |
| 34 | 76016.26 | 0.09 | 6841.464 | 82857.73 |
| 35 | 82857.73 | 0.09 | 7457.196 | 90314.92 |
| 36 | 90314.92 | 0.09 | 8128.343 | 98443.27 |
| 37 | 98443.27 | 0.09 | 8859.894 | 107303.2 |
| 38 | 107303.2 | 0.09 | 9657.285 | 116960.4 |
| 39 | 116960.4 | 0.09 | 10526.44 | 127486.9 |
| 40 | 127486.9 | 0.09 | 11473.82 | 138960.7 |
| 41 | 138960.7 | 0.09 | 12506.46 | 151467.2 |
| 42 | 151467.2 | 0.09 | 13632.05 | 165099.2 |
| 43 | 165099.2 | 0.09 | 14858.93 | 179958.1 |
| 44 | 179958.1 | 0.09 | 16196.23 | 196154.4 |
| 45 | 196154.4 | 0.09 | 17653.89 | 213808.3 |
| 46 | 213808.3 | 0.09 | 19242.74 | 233051 |
| 47 | 233051 | 0.09 | 20974.59 | 254025.6 |
| 48 | 254025.6 | 0.09 | 22862.3 | 276887.9 |
| 49 | 276887.9 | 0.09 | 24919.91 | 301807.8 |
| 50 | 301807.8 | 0.09 | 27162.7 | 328970.5 |
| 51 | 328970.5 | 0.09 | 29607.35 | 358577.9 |
| 52 | 358577.9 | 0.09 | 32272.01 | 390849.9 |
| 53 | 390849.9 | 0.09 | 35176.49 | 426026.4 |
| 54 | 426026.4 | 0.09 | 38342.37 | 464368.7 |
| 55 | 464368.7 | 0.09 | 41793.19 | 506161.9 |
| 56 | 506161.9 | 0.09 | 45554.57 | 551716.5 |
| 57 | 551716.5 | 0.09 | 49654.49 | 601371 |
| 58 | 601371 | 0.09 | 54123.39 | 655494.4 |
| 59 | 655494.4 | 0.09 | 58994.49 | 714488.9 |
| 60 | 714488.9 | 0.09 | 64304 | 778792.9 |
| 61 | 778792.9 | 0.09 | 70091.36 | 848884.2 |
| 62 | 848884.2 | 0.09 | 76399.58 | 925283.8 |
| 63 | 925283.8 | 0.09 | 83275.54 | 1008559 |
| 64 | 1008559 | 0.09 | 90770.34 | 1099330 |
| 65 | 1099330 | 0.09 | 98939.67 | 1198269 |
In the example above, one starts out investing $35,000 at age 25, and never adds another penny, and pays all the taxes along the way out of pocket. It also assumes a 9% annual growth rate, where I am mimicking what is close to the long-term annual return in the United States of investing in the stock market, using the S&P 500 Index as a proxy. If you could do this, the initial $35,000 would become $1.19 million by your retirement age of 65. That’s amazing. Compounding is about endurance. Notice that the final $800,000 of growth took place in the last 13 years. There’s certainly a flaw in this assumption, as there is in almost any model. You’re not going to earn 9% every year. There will be gains and losses much bigger and smaller than this along the way. But, it’s also not likely that one would start with this sum, and never save again. If you were able to save 10% of your pay starting at age 25 and kept that up over the years, the ending sum would undoubtedly be much larger.
Obviously, not every 25-year-old will become rich or wealthy. But this is a plan that all of them can follow. It’s up to them, and having the discipline to save.
Portfolio Allocations Update
As mentioned in our lead, our equity allocations in the past few weeks have been reduced from 100% to 66%, with 34% sitting in a very short-term bond fund. Two of our six stock market risk models are negative, so this is the least amount of equity exposure we’ve had since September of 2020, over one year ago. Interest rates have risen to their highest level since March, causing the S&P 500 Index to finally drop -5% from its peak. Other divergences are still in place, such as small and midcap stocks not confirming recent highs in large stocks, along with the Dow Transports and the Advance/Decline Line. Some of these divergences are about four months old, but some could be cleared up in coming weeks if stocks decide to rally once again. The longer the divergences last, and the more selective the market becomes, the more risk there will be, based on history.
On the bond side of things, our risk model for high yield bonds is still on its BUY from November 2020, and there would need to be further deterioration in prices to change that. Typically, we’ve not seen serious declines in the stock market until AFTER our high yield bond risk model has turned negative. Finally, we are about to enter what is normally the best six-month seasonal period of the year for stocks, which runs from November to April. This isn’t foolproof. The more unfavorable period, running from May to October, has had the S&P 500 gain 4.28% since the last signal so it’s not paid dividends to be negative on stocks during the “worst” six months. Who knows, maybe the “best” six months will turn out to be a bust.
Material Of A Less Serious Nature
Friends, please put on a mask. It saves lives. Yesterday a friend of mine went out with his girlfriend, and on the way, passed by his wife, and she did not recognize him. The mask really saved his life.
And, for those of you who were wondering how Starbucks makes all those pumpkin lattes at this time of year, well, wonder no more. See below.

Man, that looks painful. No lattes for me. But I am wishing for an Orange & Black October—hoping my SF Giants will prevail tomorrow night against the Dodgers in one of the greatest post-season matchups in baseball history. Hoping all you Dodger fans will be feeling blue at about 9:15 pm Pacific time, give or take. Happy Halloween to everyone. It looks like we’ll actually have Trick or Treating in 2021!
Sincerely,

Bob Kargenian, CMT
President
TABR Capital Management, LLC (“TABR”) is an SEC registered investment advisor with its principal place of business in the state of California. TABR and its representatives are in compliance with the current notice filing and registration requirements imposed upon registered investment advisors by those states in which TABR maintains clients. TABR may only transact business in those states in which it is notice filed, or qualifies for an exemption or exclusion from notice filing requirements.
This newsletter is limited to the dissemination of general information pertaining to our investment advisory/management services. Any subsequent, direct communication by TABR with a prospective client shall be conducted by a representative that is either registered or qualifies for an exemption or exclusion from registration in the state where the prospective client resides. For information pertaining to the registration status of TABR, please contact TABR or refer to the Investment Advisor Disclosure web site (www.adviserinfo.sec.gov).
The TABR Model Portfolios are allocated in a range of investments according to TABR’s proprietary investment strategies. TABR’s proprietary investment strategies are allocated amongst individual stocks, bonds, mutual funds, ETFs and other instruments with a view towards income and/or capital appreciation depending on the specific allocation employed by each Model Portfolio. TABR tracks the performance of each Model Portfolio in an actual account that is charged TABR’s investment management fees in the exact manner as would an actual client account. Therefore the performance shown is net of TABR’s investment management fees, and also reflect the deduction of transaction and custodial charges, if any. All performance data reflect the reinvestment of dividends and capital gains, where applicable.
Comparison of the TABR Model Portfolios to the Vanguard Total Stock Index Fund, the Vanguard Total International Stock Fund and the Vanguard Total Bond Index Fund is for illustrative purposes only and the volatility of the indices used for comparison may be materially different from the volatility of the TABR Model Portfolios due to varying degrees of diversification and/or other factors.
Past performance of the TABR Model Portfolios may not be indicative of future results and the performance of a specific individual client account may vary substantially from the composite results above in part because client accounts may be allocated among several portfolios. Different types of investments involve varying degrees of risk, and there can be no assurance that any specific investment will be profitable.
For additional information about TABR, including fees and services, send for our disclosure statement as set forth on Form ADV from us using the contact information herein. Please read the disclosure statement carefully before you invest or send money. This letter contains information derived from third party sources. Although we believe these sources to be reliable, we make no representations as to their accuracy or completeness. This letter contains certain forward-looking statements that indicate future possibilities. Due to known and unknown risks, there is no guarantee that any views and opinions expressed herein will come to pass.
A list of all recommendations made by TABR within the immediately preceding one year is available upon request at no charge. The sample client experiences described herein are included for illustrative purposes and there can be no assurance that TABR will be able to achieve similar results in comparable situations. No portion of this writing is to be interpreted as a testimonial or endorsement of TABR’s investment advisory services and it is not known whether the clients referenced approve of TABR or its services.