Two Really Good Years For Stocks. But The Good Times Never Last Forever.
If you purchased an S&P 500 Index Fund or the QQQ (Nasdaq 100) at the end of 2022 and held on the past 24 months, you would have earned 57% and 94%, respectively, on your money.
As a result of this, stock market valuations are now at their second highest level in history, and almost no one cares about valuation, or the price paid. Inside, we’ll explore the likely outcomes of these implications looking out 10 years.
In addition, we’ll touch on a recap of our results from last year and a new policy that Fidelity Investments is implementing in coming months, as a result of the pressures in the industry to find new sources of revenue/profit. And always, something to brighten your day at the end. A year ago this time I was writing about a possible 49ers Super Bowl Championship. Now, I’m praying for Philly Green. Sorry, Taylor.
We Believe In Market Cycles
Since 1926, when I believe the most reliable data on the U.S. stock market begins, stocks as measured by the S&P 500 have compounded at about 10% per annum, and on a calendar year basis, have showed positive returns essentially in 3 of every four years. Within those nearly 100 years, though, there have been booms and busts. Since March of 2009, which was the conclusion of the Great Financial Crisis (GFC), when the S&P 500 concluded a -57% drop from October of 2007, the index has compounded at over 16% per annum for the past nearly 16 years. Last I looked, that is 60% over the long-term trend.
Prior to the last “bust” which took place from 2000 to 2009, when the S&P 500 lost money for 10 years, there was a similar boom to what is taking place right now. From December 1981 to December 1999, the S&P 500 compounded at 16.80% per annum. That advance concluded with what was known as the Internet Bubble. Yale economist Robert Shiller created the CAPE Ratio in 1988 to measure valuations in the U.S. Stock Market, with the CAPE standing for Cyclically Adjusted Price Earnings Ratio. Instead of only looking at either forward earnings of one year, or trailing earnings of one year, Shiller felt that smoothing the calculation of the past 10 years would be more relevant in reflecting the business cycle.
We had the team at Ned Davis Research (thank you, Rico!) create a custom version of the indicator below, going back to 1926, using monthly data. That chart and table are below. We had them plot all the data into quintiles, and then showed the median returns for each quintile, and the gain per annum, along with the maximum and minimum returns in each quintile. As you’ll see, modeling is not perfect at all. When the ratio has been in the 5th quintile, above 25.85, median returns were still 4.6% per annum, but the worst return was -4.6% and the best was 13.3%. And remember, that’s for 10 years, not one year.
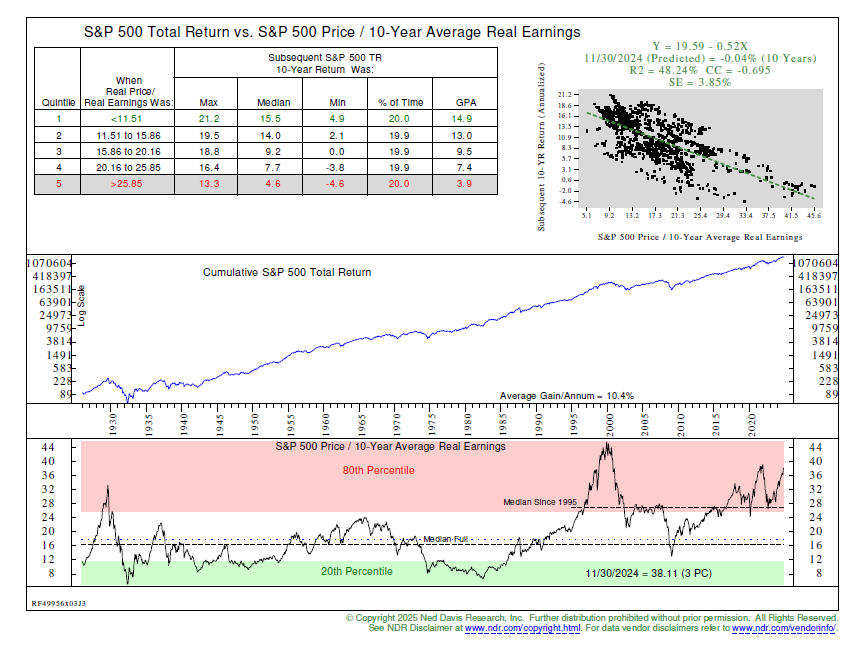
The knock on this model indicator is that it has been suggesting stocks were expensive for many years, and they keep going up. That’s true, until they don’t. The current reading of the ratio on November 30, 2024 of 38.11 is the third highest in history, only exceeded by 1999 and 2021. We’ve also plotted the median of the indicator going back to 1926, but also only since 1995. The median going back to 1926 is just above the 16 level, but since 1995 it has risen to around 27. Many bullish analysts argue that the U.S. economy is different today than it was 30 years ago, reflecting more of a service/technology revolution rather than an industrial/manufacturing mindset. There’s definitely truth to that argument, with the likes of Amazon, Apple, Microsoft, Nvidia and Salesforce now all part of the Dow Jones Industrial Average (perhaps an oxymoron today).
In my view, two key things have taken place in the last 30 years and they are inter-related. Price to earnings ratios have expanded faster than earnings have grown due to expanding profit margins, which are directly linked to lower bond yields. But the secular drop in bond yields from 1982 to 2022 is over, and not likely to be repeated for decades. Even accepting a new median of 27 for the modern era places the CAPE ratio nearly 30% above its 30-year mean. The predicted return from current levels 10 years out is essentially a zero total return. As you’ll see below, this is in the range of other similar predictive models.
Price earnings ratios have expanded because of lower interest rates, and likely an improvement in productivity. But the decline in interest rates is likely over, as the chart below suggests, also from Ned Davis Research.
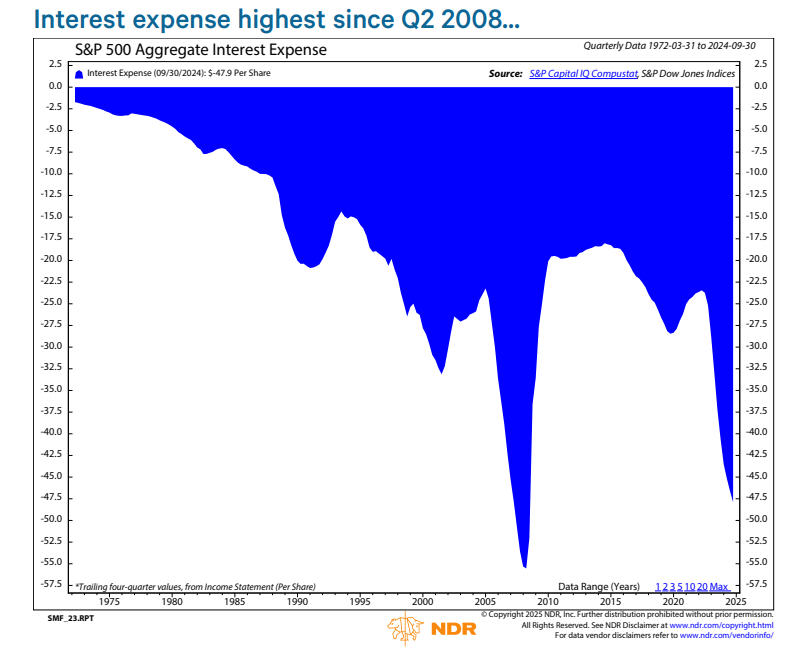
Since 2015, the yield on the 10-year Treasury Note has been mostly below 3% until the latter part of 2022, and it’s now trading at 4.55%. The Federal Reserve took the Fed Funds rate to 0% and kept it there for many years until 2022, and then began hiking it 11 consecutive times until this past September, up to the 5.25% level and now down to 4.25%. As Ed Clissold from NDR noted recently, the more time that passes from the ZIRP (Zero Interest Rate Policy) era, the more that large-cap companies will need to refinance at higher rates. This is expressed in the chart above. Throw in growing $trillion government deficits, and it’s difficult to see anything but higher inflation and higher interest rates.
Our CAPE ratio chart above is just one method of valuing U.S. stocks. It’s not even the best, in terms of correlating with future 10-year returns, which is at nearly 70%, a very strong reading. Other methods are suggesting similar outcomes. Can they all be wrong? Below is a chart that Howard Marks of Oaktree Capital featured in his latest memo. It’s from J.P. Morgan Asset Management. They plotted the S&P 500 Forward P/E ratio, which is represented by the squares, for each month from 1988 through the latter part of 2024. All in all, there are 324 monthly observations, so for you statistical geeks, this is significant, with a high confidence level. Today’s ratio of 22 is clearly in the top decile of the data.
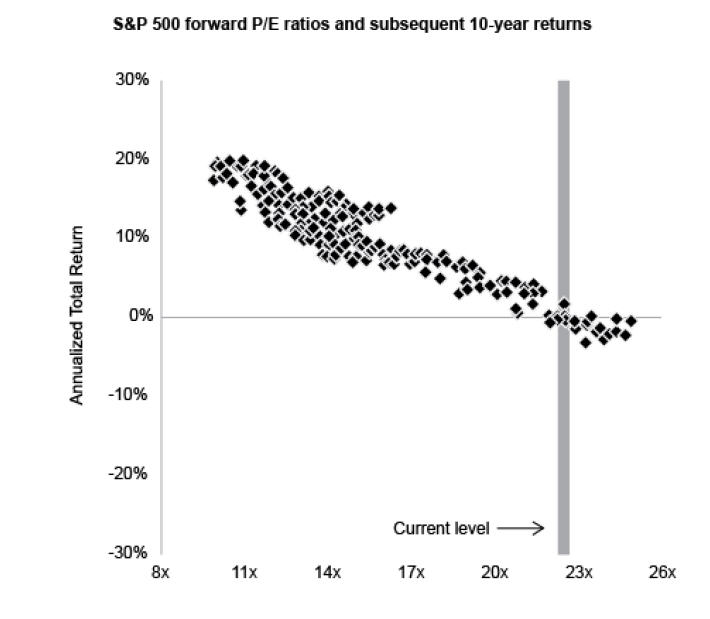
In that 27 year period, if you bought the S&P 500 at p/e ratios in line with the current multiple, the results 10 years later were ALWAYS between +2% and -2%.
All of this data and conjecture doesn’t change anything we’re doing, as this information is simply helpful in identifying where we likely are in the market cycle. More than likely, we’re at the top. But if our models continue to suggest heavy exposure, that’s what we’ll do, until they change. With investment grade bond yields in the 4.75% range going out to 2026 and 2027 in maturity, you can see why we think fixed income has a very good chance to do better than stocks in coming years, at least until there is a significant drop in stock prices.
Changes To Fidelity Core Cash Accounts And The Pressure To Increase Revenue
In late December, all of our clients at Fidelity Investments received a letter, either via snail mail or email, regarding an upcoming change to the core transaction account option in their brokerage account. At present, that option is Fidelity Treasury Money Market Fund (FZFXX) in taxable brokerage accounts, and Fidelity Government Cash Reserves (FDRXX) in retirement accounts. The “core” position processes cash transactions and uninvested cash. When we send funds to your bank, it comes out of the core fund. When you send funds for deposit, it goes into the core fund. For accounts that do not take regular income, we typically hold about 1.25% in cash for a full year, to have on hand to pay our management fees. For accounts that take income, the amount of cash can vary, but can run up to 4% to 6% or more of an account’s total value.
Sometime in the first six months of this year, all taxable accounts will have their core fund switched to Fidelity’s FCASH. This is a taxable, interest bearing cash sweep option, that is similar in nature to Schwab’s Bank Option, in that it allows the firm (Fidelity or Schwab) to invest the money in higher options for their own account. The similarities end there, as Schwab Bank pays 0.05% on their money, and Fidelity’s rate is currently 2.19%. However, and here’s the rub, the yield on FZFXX is currently 4.02%. At present, please note that this change does not affect retirement accounts, nor retail accounts.
What does this mean? It means going forward, Fidelity is going to be paying almost 50% less on your idle cash than they have in the past. Let me give you an example to quantify this. Our median account size is about $700,000. If we keep 1.25% of cash on hand at the beginning of each year, that amounts to $8,750. That cash amount will go down each quarter as fees are deducted, but for a moment, just play along. Let’s just say the money sits there the whole 12 months. At 4.02%, it would earn $351 in interest. Under FCASH, that would be reduced to $191, so one would receive $160 less per year. And as they say using internet slang, YMMV depending on the amount.
Why is this happening? Simply put, Fidelity is trying to find ways to earn more revenue. There is currently $43 billion in FZFXX, so if you roughly take 2% of that, you’re looking at $860 million. And that’s just one fund. That’s not chump change. For those of you who may have brokerage accounts at Charles Schwab, this practice has been going on at Schwab for years, and the gap between where yields really are and what Schwab pays from their bank is nearly 4% at current levels. One should note that Schwab earns nearly 50% of their revenue from interest income.
Keep in mind that your custodian, whether it be Fidelity, Charles Schwab or others, needs to make a profit. And sometimes, that profit is at the expense of their clients. We as clients, cannot expect to have “free” trading commissions and NTF mutual fund trading (no transaction fees) and expect the custodian to offer all of the conveniences that they do in maintaining accounts, providing custody, record-keeping and all of the amazing technology that works on your desktop or phone, without them earning a fair return on their investment. But sometimes, what they do can cross the line of being a fiduciary, where actions are not at all in the best interests of clients.
This was disturbingly clear in a recent article in the Wall Street Journal by Jason Zweig. It appeared in the Saturday edition a week ago on January 18-19, and was titled “Your Adviser Is Under Pressure To Take Another Bite Of Your Money.” A link to the article is below.
https://www.wsj.com/finance/investing/what-you-dont-know-could-sting-your-portfolio-6c095df2
In the article, another advisor who runs a $900 million practice in Pittsford, NY was told by his Fidelity rep that his firm needed to generate at least $90,000 or more in revenue for Fidelity, with various ways to do that. What was unsaid in the article was that if the firm did not do that, Fidelity would begin charging his firm to custody their assets with them. I have no idea how much, but with that kind of AUM (assets under management), it wouldn’t be surprising to be told, “hey, you need to give us $90,000 a year.” Mind you, a firm with $900 million in AUM is likely generating revenue of around $9 million per year.
You might be asking me–has this happened to you guys at TABR? I’m a believer in being transparent, and the answer is no, but that is because Fidelity has told us that our practice is profitable for them under the business mix that we have, and comfortably so. It’s a simple mix of mutual funds, ETFs and individual stocks and some Treasury Notes. We currently have about $220 million under management at Fidelity, and do not use any other custodians for our clients, with the exception of using American Funds who manages all of our clients’ 529 college accounts. I can tell you that other firms who are being served by our rep at Fidelity have not had the same experience as us. That is totally dependent upon not only how much money your firm has at Fidelity, but importantly as the article implies, how that money is invested.
If we had $100 million of individual stocks at Fidelity out of our $220 million, it would be a very different conversation and in all likelihood, we would be asked to pay. Why? Simply because Fidelity and other custodians cannot make any money off of holding individual stocks or bonds. There are no on-going fees, and there are no trading commissions. In 2018, stock trading commissions were generally in the $4.95 to $9.95 range for a standard stock order. Robinhood, the trading app that caters to young investors (mostly males in the 18 to 30 year old range), started commission-free trading via their app in 2014, but it really didn’t take off until around 2019 and 2020, when Fidelity and Schwab felt the pressure and also introduced commission free trades. Don’t underestimate the amount of revenue that has been lost by this change.
In addition, the advent of ETFs (exchange traded funds) has polarized the mutual fund business, and this has also significantly reduced revenue for Schwab and Fidelity. It used to be that mutual fund firms would pay Fidelity and Schwab 40 basis points, or 0.40% per annum, to be listed and available for purchase on their no-transaction fee fund platforms. That’s virtually impossible now as ETFs have surpassed mutual funds in popularity, and also because many investors have concluded (like us in some areas) that paying high management fees of 0.75% to 1% per annum to actively managed funds is inferior to owning an ETF which charges 0.10% or 0.20% per annum. A specific breakdown is not available as to how much money is in AUM for Fidelity in their NTF platform. Just do the math, though. For every $100 billion, receiving 20 basis points less is $100 million per year.
Now you know why Fidelity and other custodians are looking for more revenue. There is another method in which a custodian can generate more revenue, and its called Payment For Order Flow, or PFOF. Payment for order flow is the practice of market makers paying a commission to brokers for sending trades to them. Fidelity does not accept payment for order flow, nor does Vanguard, but Charles Schwab does, and so does Robinhood. Fidelity instead returns the benefit of market maker economics to its customers in the form of price improvement on orders.
There are obviously different viewpoints about that practice. My own opinion is that the price improvement referred to is so minimal, that the typical client would never even notice it. They can’t relate to getting Apple for $239.34 per share instead of $239.36. What most clients CAN relate to is this—you used to pay me 4% on my cash, and now you’re paying me 2.2%? Screw that. Take the payments for order flow. In any case, this is what is going on in our industry, and we wanted you to be aware of it. Of course, if you don’t read our monthly updates, well, you’re SOL. 🙂
TABR Portfolio Allocations Update
At this writing, our tactical equity exposure is at about 66%, the other 34% in cash. Meanwhile, our high yield bond risk model remains on its November 2023 BUY signal. Though credit spreads are quite low, they have not been rising. I suspect downside risk in stocks will be delayed until this model actually turns negative.
A Look Back At 2024
We’ve always found it useful to look backwards and contemplate what we’ve done. This can be helpful even when things seem to be going right, but even more so when they’re not. It’s how one can make course corrections, and fix things.
Transparency has been a fixture at TABR since we were founded in 2004. The vast majority of RIAs in our business do not publish a track record. They may cite compliance issues, or the work necessary to comply with regulations, or that all their clients have “customized” portfolios. Simply put, we do publish one, because we believe in our process, and our staff backs that up by investing the vast majority of their personal savings in the exact same strategies we use for clients.
Sometimes, the numbers aren’t pretty, and other times, they are great. That is part of being in investment management. Even the best money managers in the business go through years of underperformance. We are no different. The key is, in our view, sticking with your discipline, but also having the courage to fix things when something may be amiss.
And though below you will see comparisons to industry benchmarks, ultimately we are judged by helping our clients achieve their goals, with substantially less risk than passive, buy and hold strategies. Besides our combined 61 years of financial planning and investment management wisdom, that is probably the one big difference and edge we have over competitors. I should note that we do have buy and hold, fully invested strategies, as they serve as diversification with our main approach, and can appeal to some clients who want to be more aggressive with a part of their capital. All of those results are included below.
Here’s the high level summary of how passive benchmarks performed, and then we dive into the details.
For the calendar year 2024, the Vanguard Total Bond Index Fund gained 1.24%. This fund makes up 45% of our Tactical Moderate Allocation benchmark. The Vanguard Total International Stock Fund gained 5.14% for the year and makes up 13.75% of the benchmark. The Vanguard Total Stock Market Index Fund gained 23.74% for the year and makes up 41.25% of the benchmark. Though similar, but not exactly, the Vanguard S&P 500 Index Fund gained 24.97% for the year.
The majority of our risk management models for the stock market are trend-following in approach. There was very little downside during the year, with the worst drawdown for the S&P 500 taking place between mid-July and early August, a drop on a closing basis of -8.48%. The average drawdown during a typical year is -14%. As a result, three of our risk models never generated a SELL signal during the year, and we had average equity exposure of about 75%. All in all, it was a perfect type of environment for our approach, and combined with relative strength, all of our tactical strategies beat their benchmarks, and with much less risk.
Specifically, our Moderate Tactical account gained 12.54% versus the benchmark of 11.17%. Our Conservative Tactical account which is 65% in fixed income, gained 9.60% versus its benchmark of 7.44%. And our all-bond account gained 5.54% versus its benchmark of 1.24%. The only area that lagged was our Passive Index account, which invests strictly in Vanguard Funds. The account gained 8.05%, lagging its benchmark, which gained over 11%. The culprit was owning international stocks, small stocks and midcap stocks and real estate. Diversification here didn’t help, but rather hurt.
Relative strength played a key part in our edge last year. It is at the core of our selection process and for the majority of the year, our equity exposure in tactical accounts was concentrated in the large growth segment of the market (think OEF, IVW and QQQ). We track a hypothetical account of this process to see these very things, and a fully invested account owning the best three ETFs each month and rebalancing equally each month would have earned over 26% for the year, beating a 75%/25% mix of Total Stock and Total International by over 700 basis points. This helped us to overcome a lag from our sector strategy and style box strategy, which we use for our core 20% minimum exposure. In 2024, the sectors were up 18.69% and the style box was up 13.40%. We’re continuing those approaches, as we gather long-term data to decide at some point whether or not they are adding value or not, compared to our core tactical approach.
Speaking of relative strength, this is also at the heart of the stock strategy we began using in early 2020, with the universe of the S&P 100 to pick from. That strategy only owns the top-ranked stocks each month of the S&P 100. We also started for 2024 a similar strategy where the universe is expanded to the S&P 500. In that account, there are typically over 100 stocks each month ranked highest, and we then winnow that number down to the top 30. Based on prior hypothetical results, plus the real-time results from 2024, we’ve now switched all accounts to the S&P 500 universe going forward.
This is our most aggressive strategy. It is fully invested at all times, with no defense. In 2024, net of our fees, the account gained 30.78%, beating the Vanguard S&P 500 Fund at 24.97%. We now have nearly 5 years of real-time results, and it’s been quite encouraging. Our account has compounded at 19.44% versus 14.90% for the benchmark. We’re now running 46 accounts in this strategy, with several $million dollars. It will eventually have its hiccups at some stage, including earlier this week when the accounts went down over -5% in one day. This is partly why we phase money into this strategy over a period of typically one to two years.
Below is the performance, net of management fees, of TABR’s six different portfolios at present. These represent a majority of the strategies we are using in client accounts, but not all. The differences are mainly attributed to risk (example–moderate allocation versus conservative allocation or aggressive) and account size. The numbers are for the time periods of the past year, the past 5 years and 10 years (if applicable) in accordance with SEC performance reporting requirements. We’ve also provided appropriate benchmarks for each strategy.
| Type Of Account/Strategy | 2024 Return | 5 Years Ended 2024 (or since inception) | 10 Years Ended 2024 (or since inception) |
| TABR Tactical Moderate | 12.54% | 4.01% | 3.75% |
| Moderate Benchmark (40/15/45)* | 11.17% | 6.13% | 6.44% |
| TABR Tactical Conservative | 9.60% | 2.91% | 2.98% |
| Conservative Benchmark (26/9/65)** | 7.44% | 3.77% | 4.57% |
| TABR Bond Account | 5.54% | 0.98% | 2.21% |
| Bond Benchmark (Vanguard Total Bond VBMFX) | 1.24% | -0.32% | 1.33% |
| TABR Passive Index Mix (Moderate) | 8.05% | 4.69% | 6.01%(since 12-31-15) |
| TABR Tactical Stock (100% stock/tactical) | 21.28% | 7.80% | 8.59(since 12-14-18) |
| Tactical Benchmark (75/25)*** | 19.08% | 11.42% | 13.80%(since 12-14-18) |
| TABR Relative Strength OEX S&P 100 | 30.78% | 19.44% (since 2-24-20) | n/a |
| Relative Strength Benchmark (VFINX 500) | 24.97% | 14.90% (since 2-24-20) | n/a |
| Vanguard Total Stock Market Index (VTSMX) | 23.74% | 13.80% | 12.49% |
| Vanguard Total International Stock Index (VGTSX) | 5.14% | 4.28% | 5.06% |
Note–all returns cited include reinvested dividends.
*consists of 45% Vanguard Total Bond, 41.25% Vanguard Total Stock and 13.75% Vanguard Total International Stock
**consists of 65% Vanguard Total Bond, 26% Vanguard Total Stock and 9% Vanguard Total International Stock
***consists of 75% Vanguard Total Stock and 25% Vanguard Total International Stock
Material Of A Less Serious Nature
Two babies were sitting in their cots, when one baby shouted to the other, “Are you a little girl or a little boy?”
“I don’t know,” replied the other baby, giggling. “What do you mean, you don’t know?” said the first baby.
“I mean I don’t know how to tell the difference,” replied the second baby. “Well, I do,” said the first baby, chuckling. “I’ll climb into your cot and find out.”
He carefully maneuvered himself into the other baby’s cot, then quickly disappeared under the blankets. After a couple of minutes, he resurfaced with a big grin on his face.
“You’re a little girl, and I’m a little boy” he said proudly.
“You’re ever so clever,” cooed the baby girl. “But how can you tell?”
“It’s quite easy, really,” replied the baby boy. “You’ve got pink socks, and I’ve got blue ones.”
What were you thinking? 🙂
As always, thank you for your trust and confidence in all of us at TABR, and for allowing us to serve you. Here’s wishing you a great 2025.
Sincerely,

Bob Kargenian, CMT
President
TABR Capital Management
TABR Capital Management, LLC (“TABR”) is an SEC registered investment advisor with its principal place of business in the state of California. TABR and its representatives are in compliance with the current notice filing and registration requirements imposed upon registered investment advisors by those states in which TABR maintains clients. TABR may only transact business in those states in which it is notice filed, or qualifies for an exemption or exclusion from notice filing requirements.
This newsletter is limited to the dissemination of general information pertaining to our investment advisory/management services. Any subsequent, direct communication by TABR with a prospective client shall be conducted by a representative that is either registered or qualifies for an exemption or exclusion from registration in the state where the prospective client resides. For information pertaining to the registration status of TABR, please contact TABR or refer to the Investment Advisor Disclosure web site (www.adviserinfo.sec.gov).
The TABR Model Portfolios are allocated in a range of investments according to TABR’s proprietary investment strategies. TABR’s proprietary investment strategies are allocated amongst individual stocks, bonds, mutual funds, ETFs and other instruments with a view towards income and/or capital appreciation depending on the specific allocation employed by each Model Portfolio. TABR tracks the performance of each Model Portfolio in an actual account that is charged TABR’s investment management fees in the exact manner as would an actual client account. Therefore the performance shown is net of TABR’s investment management fees, and also reflect the deduction of transaction and custodial charges, if any.
Comparison of the TABR Model Portfolios to the Vanguard Total Stock Index Fund, the Vanguard Total International Stock Fund, the Vanguard Total Bond Index Fund and the S&P 500 Index is for illustrative purposes only and the volatility of the indices used for comparison may be materially different from the volatility of the TABR Model Portfolios due to varying degrees of diversification and/or other factors.
Past performance of the TABR Model Portfolios may not be indicative of future results and the performance of a specific individual client account may vary substantially from the composite results above in part because client accounts may be allocated among several portfolios. Different types of investments involve varying degrees of risk, and there can be no assurance that any specific investment will be profitable
For additional information about TABR, including fees and services, send for our disclosure statement as set forth on Form ADV from us using the contact information herein. Please read the disclosure statement carefully before you invest or send money.
A list of all recommendations made by TABR within the immediately preceding one year is available upon request at no charge. The sample client experiences described herein are included for illustrative purposes and there can be no assurance that TABR will be able to achieve similar results in comparable situations. No portion of this writing is to be interpreted as a testimonial or endorsement of TABR’s investment advisory services and it is not known whether the clients referenced approve of TABR or its services.