Unsustainable. And An Ominous Magazine Cover
Nearly 17 years ago on March 9, 2009, the stock market bottomed, concluding a -57% drop which started in October 2007. Since then, the S&P 500 has achieved compound annual returns of about 15.19%, closing positive in 15 of the 17 calendar years since then.
As a result, a large swath of investors have been conditioned that stocks mostly only go up. The reality is, though, that market trends go in cycles, and inevitably, long periods of above average returns are followed by long periods of below average returns.
That’s where we think we are, even accounting for the considerable hype in Artificial Intelligence (AI). Nobody knows where the top is, and our own risk models are still uniformly bullish. Inside, we’ll examine the data regarding mid-term election years and the concern from a recent TIME Magazine Cover, which named a plethora of AI Tech billionaires their “Person Of The Year.”
There’s definitely conflicting evidence as to how 2026 will turn out. Optimism has paid off for many years. We think realism will better serve investors until there’s a significant drop in prices. Read on.
Broad Participation Isn’t As Bullish As It Seems
As technology stocks have increasingly led the market in recent years, there has been concern over the concentration in the S&P 500 of just a few stocks, and its impact on the index. As of December 31, 2025, the technology sector accounted for 35% of the index, and the top 10 stocks in the index, from Nvidia to Berkshire Hathaway, accounted for over 39% of the index. This hasn’t stopped the index from posting three consecutive double-digit gains.
Since the October 29, 2025 peak in the Nasdaq 100 (NDX), where it has since fallen -4%, small and mid-cap stocks along with “value” stocks have been strongly outperforming, implying a broadening of the advance. As the chart below from Ned Davis Research (NDR) shows (www.ndr.com), through February 6 of this year, over 65% of S&P 500 stocks were outperforming the S&P 500 year-to-date. The index is up 1.35%, while the S&P Midcap Index (MDY) is up 8.63% and the S&P Small Cap Index (IJR) is up 9.81%.
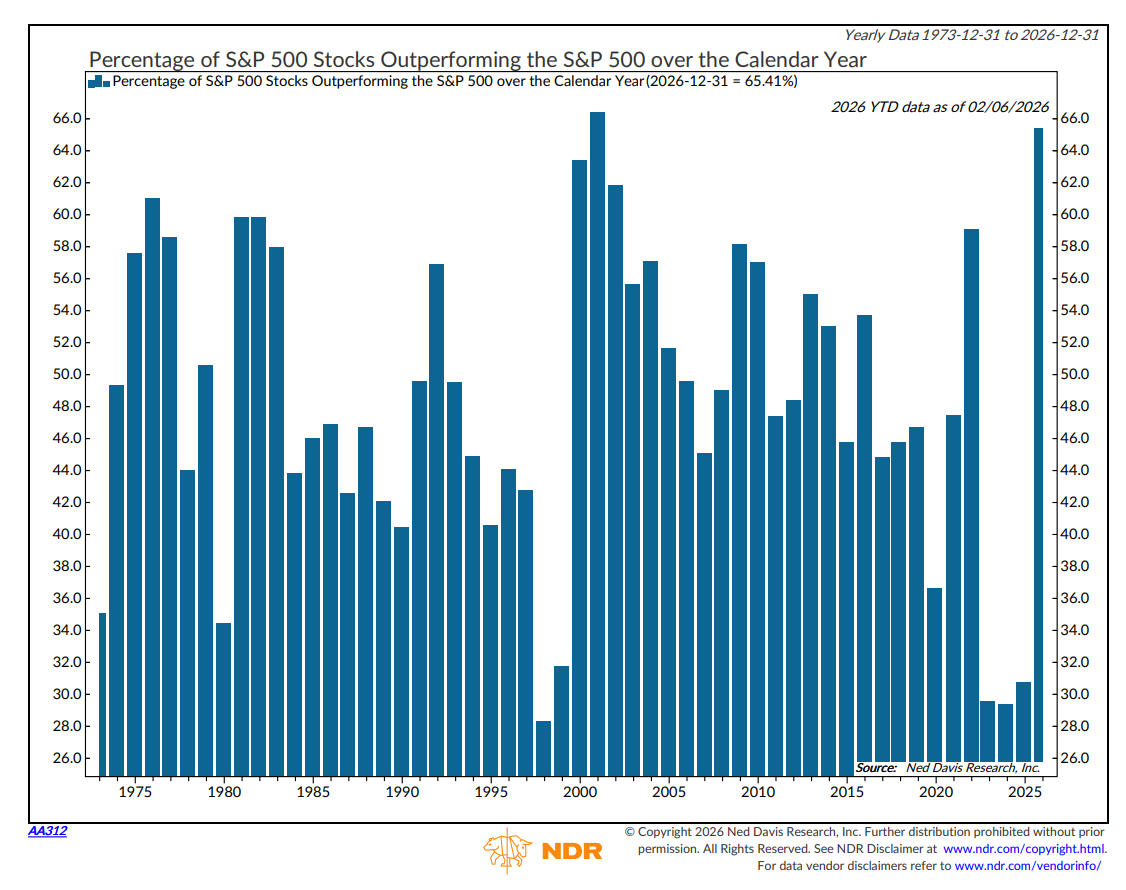
We have nearly 11 months still to go, but in the four years since 1973 when over 60% of the stocks outperformed, the S&P 500 fell, with a median return of -11.6%. That’s not many data points, but the implications are supported by below average returns in mid-term years of the four-year election cycle. In data back to 1872, according to NDR, the average gain in a mid-term year has been 4.6% with median gains at 2.0%.
Similarly, analyst Wayne Whaley (waynewhaley.com) notes that since 1900, mid-term election years have gone 16-15 for average annual gains of just 2.82%. In other words, when the norm is that stocks close positive 75% of the time and we’re in a year when the norm is closer to 50%, it’s time to temper one’s expectations.
For the optimists, though, Whaley also has a very positive study that we’ll know more about after Monday’s close. He has examined TOY (turn of the year) data on the S&P 500 going back about 100 years and has various studies he tracks. One is measuring the performance of the index from November 19 to February 9. When gains in this time period are greater than 3.65%, the following year’s performance (February 9 to February 9) is positive 38-1, with average gains of 15.54%. Needless to say, that is statistically significant, and with one day to go on Monday, the gain for this time period currently sits at +4.37%.
Which factors will ultimately dominate the narrative this year? That’s impossible to know, but siding with the negative side is a recent cover from TIME Magazine.
The Magazine Cover Contrary Indicator
Late analyst Paul Macrae Montgomery of Universal Economics is widely credited with creating what is known as the magazine cover contrary indicator. The premise is that magazine editors of mainstream news publications such as TIME are typically late to spot trends, so when a person or company appears on the cover, it’s often a sign that the trend is already been played out or discounted.
Two prominent examples are Businessweek’s “The Death of Equities” cover in 1979, which took place near the end of the below average decade of the 1970s, just prior to the 1980s bull market, along with TIME’s bearish cover on March 9, 2009, “Holding on for Dear Life.” That day was the exact bottom in the S&P 500.
I was able to find three studies on the effectiveness of the indicator, subjective as it might be. A Citigroup Analysis from 2016 looked at 25 years of covers from The Economist, and found that 68% of the time, the cover was a wrong indicator one year later. Similarly, a study by Greg Marks and Brent Donnelly looking at TIME and Economist covers from 1997 to 2024 found that the covers have strong predictive power as contrarian signals.
I’ll extend this line of thinking to Super Bowl ads, since the big game was yesterday, and you’ll be reading this after the fact. I never acted on this (DAMN!), but I remember watching the game in 2022 and noticing all the ads from celebrities that year pitching crypto currencies. Bitcoin was not easily available to purchase then other than through wallets, but it went on to lose 60% that year which was capped by Sam Bankman Fraud (my name for him) eventually going to jail for ripping off all of his customers in a massive scheme where he and others spent customer money that wasn’t theirs.
So, what gives me pause at this time? Look at TIME Magazine’s cover in December, shown below, where they name their Person of the Year, anointing several AI Architects together for their roles, including Sam Altman, Elon Musk, Mark Zuckerberg and Nvidia’s Jensen Huang.

There’s considerable debate as to whether AI stocks and technology in general are in a bubble (similar to 1999). Putting AI and its main players on the cover suggest most people are already invested, and the momentum has nowhere to go (but down). Anecdotally, it’s been noted that for timing purposes, a top or bottom typically occurs about 2 to 3 months after the appearance of the magazine cover. Since TIME published on December 11, we’re pretty much getting into that time window. If a bear market develops this year, this indication strongly suggests that AI stocks and technology in general will lead the way down.
By the way, it’s also not comforting that ALL the 21 strategists at major financial firms interviewed by Bloomberg near year-end 2025 expect stocks to rise in 2026. Not a single one is predicting a decline. That’s not comforting.
A Potential Likely Path
Each year around this time, we typically feature the S&P 500 Cycle Composite created by Ned Davis Research for the coming year. The 2026 version is shown below, and is an equal-weight blend of the One-Year Seasonal Cycle, the Four-Year Presidential Cycle and the 10-Year Decennial Cycle.
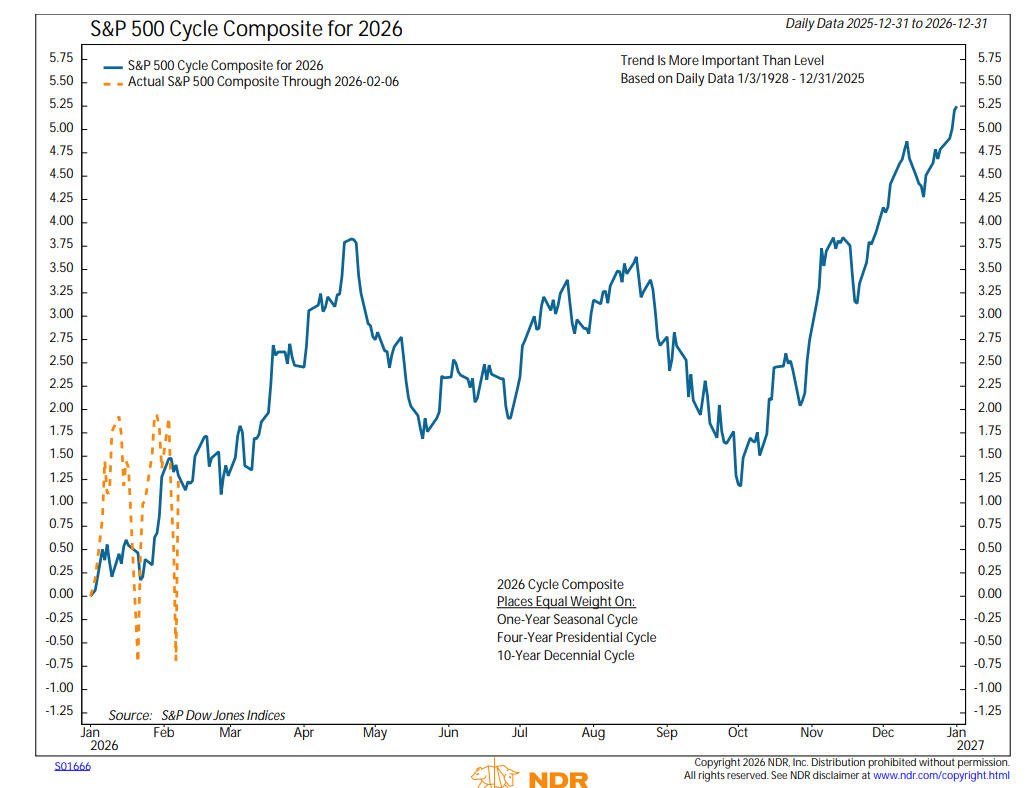
Do not get confused with the direction of the chart. It doesn’t imply an automatic gain. As noted on the chart, the trend is more important than the level. In any case, the chart implies a peak in April, coinciding with the end of the normally bullish six-month period, followed by a decline into mid-October, then a year-end rally.
Given that the NYSE Advance-Decline Line made a new all-time high this past week, and that divergences in this indicator have occurred in 90% of major market peaks historically, one possible path is for stocks to eventually make higher highs in April and create negative momentum divergences and we’ll go from there.
TABR Portfolio Allocations
Despite our concerns about valuations and market behavior, all of the quantitative evidence we follow continue to be bullish, with all five of our stock market risk models continuing in positive mode. Equity allocations have been 100% since September 11 for all but 7 days, and our high yield bond risk model continues on its BUY signal from May of 2025. This is why we follow our models, and not our gut or intuitions.
One portfolio note that just took place. In our core equity exposure, two of the three ETFs we own were sold on February 2 and replaced. The S&P 100 (OEF) and S&P 500 Large Growth (IVW) were eliminated and replaced with Vanguard Total International Stock (VXUS) and MSCI Core Emerging Markets (IEMG). Much like in the first quarter of last year, there has been substantial relative improvement in international stocks, which also created changes in our mix at that time.
In hindsight, that move hurt performance, as growth issues rebounded sharply from the Trump Tariff Tantrum. There’s no way to know that in advance. Hopefully, this change will create better outcomes than last year.
When Times Are Good, People Get Complacent
As noted above, after three straight years of double-digit gains in the S&P 500, exuberant sentiment is widespread. Though not impossible, the odds of a fourth year of gains are fairly small. Below is a quantitative way to view things, though, courtesy of researcher and trader Tom Bowley, of www.stockcharts.com.
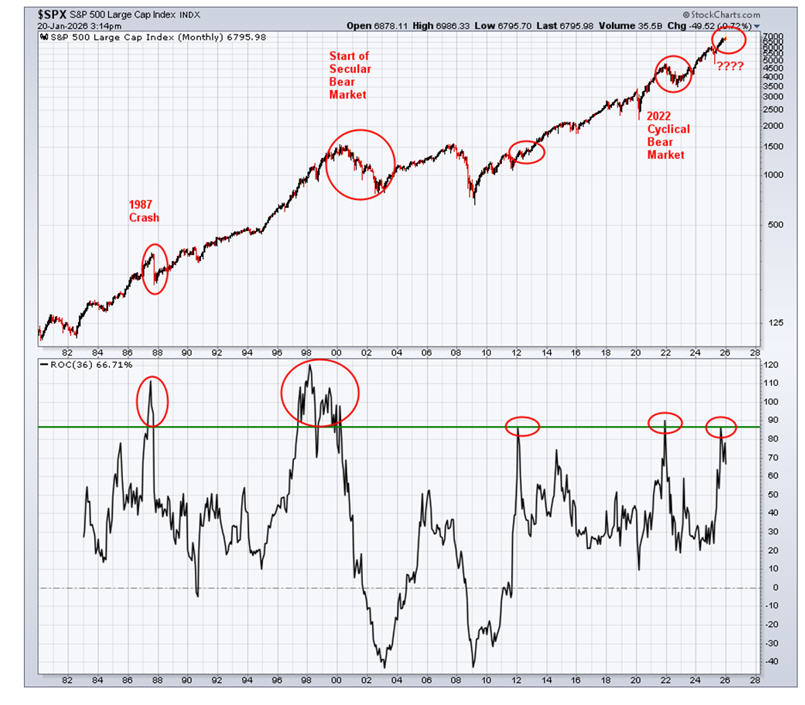
Bowley has plotted the 3-year rate of change (ROC) of the S&P 500, dating back to 1950. In October of 2025, this indicator nearly touched the 90% level, something it doesn’t do often as one can see. This simply means that for the prior 3 years, the S&P 500 had risen about 90%. Along the theme of this month’s update, that’s simply Unsustainable. You’ll notice that the indicator did not rise to near that level in 2006-07, so it’s a reminder that no methodology is perfect. However, the outcomes from prior occurrences at the 90% level aren’t encouraging.
By the way, I’ve learned not to trust anybody or any model too much, especially anything that is trying to forecast rather than react. But I will say this. Since following Bowley from about late 2021 to present, his annual forecasts have been spot on. He called the 2022 bear market in January of that year, and turned bullish in late June and again in October. Last year, in the midst of the meltdown caused by Trump’s tariff announcements, he turned bullish a few days before the bottom and with the S&P 500 around 5900, forecast the index would close the year at 7000. That was nearly spot on.
Naturally, everyone would want to know what he thinks now? He’s been quite cautious since mid-December, not liking the action in growth stocks, and in fact, the market has gone nowhere since then, though small and mid-cap stocks and international stocks have been performing quite well. Ultimately, Bowley thinks 2026 will result in a flat year for the S&P 500, with the index ending right around 7000. Hopefully, I’ve not jinxed his forecasting acumen.
A Look Back At 2025
We’ve always found it useful to look backwards and contemplate what we’ve done. This can be helpful even when things seem to be going right, but even more so when they’re not. It’s how one can make course corrections, and fix things.
Transparency has been a fixture at TABR since we were founded in 2004. The vast majority of RIAs in our business do not publish a track record. They may cite compliance issues, or the work necessary to comply with regulations, or that all their clients have “customized” portfolios. Simply put, we do publish one, because we believe in our process, and our staff backs that up by investing the vast majority of their personal savings in the exact same strategies we use for clients.
Sometimes, the numbers aren’t pretty, and other times, they are great. That is part of being in investment management. Even the best money managers in the business go through years of underperformance. We are no different. The key is, in our view, sticking with your discipline, but also having the courage to fix things when something may be amiss.
And though below you will see comparisons to industry benchmarks, ultimately we are judged by helping our clients achieve their goals, with substantially less risk than passive, buy and hold strategies. Besides our combined 67 years of financial planning and investment management wisdom, that is probably the one big difference and edge we have over competitors. I should note that we do have buy and hold, fully invested strategies, as they serve as diversification with our main approach, and can appeal to some clients who want to be more aggressive with a part of their capital. All of those results are included below.
Here’s the high level summary of how passive benchmarks performed, and then we dive into the details.
For the calendar year 2024, the Vanguard Total Bond Index Fund gained 7.17%. This fund makes up 45% of our Tactical Moderate Allocation benchmark. The Vanguard Total International Stock Fund gained 32.18% for the year and makes up 13.75% of the benchmark. The Vanguard Total Stock Market Index Fund gained 17.01% for the year and makes up 41.25% of the benchmark. Though similar, but not exactly, the Vanguard S&P 500 Index Fund gained 17.71% for the year.
The majority of our risk management models for the stock market are trend-following in approach. They’re designed to ensure as much as possible preservation of capital during significant drawdowns, typically 15-20% and greater. We began the year with tactical equity exposure of about 86%, but by March 17, we were down to 20%, with 4 of 5 of our models negative.
From February 19 to April 8, the S&P 500 fell nearly 19% on a closing basis related to Trump’s tariff announcements. Then, stocks roared back, and by June 27 had regained all of the losses. Our own models improved to 60% by April 28 and then to 80% by July 2, but only two of our five models beat the S&P 500’s return for the year, with the other three lagging badly. Coupled with a poor performance on the relative strength side of things with our ETF selection process, it turned out to be a decent year on an absolute basis, but not so hot on a relative basis. This is sometimes the price we pay for risk management.
Specifically, our Moderate Tactical account gained 8.72% versus the benchmark of 14.78%. Our Conservative Tactical account which is 65% in fixed income, gained 7.13% versus its benchmark of 11.87%. And our all-bond account gained 4.66% versus its benchmark of 7.03%. Our Passive Index account, which invests in a 60/40 stock/bond mix, earned a 12.21% return but also trailed the Moderate benchmark of 14.78%, mostly due to exposure in small and mid-cap stocks along with a small allocation to real estate trusts.
Relative strength is at the core of our selection process and it has worked quite well over long periods of time, but nothing works every year and 2025 was one of them. We began the year owning large growth (OEF, IVW and QQQ) which had been leading the market for most of 2023 and 2024. But they lagged strongly in the decline early in the year, while international stocks rose to the top of our rankings. By April 1, 2/3 of our core equity exposure had switched to international (IEV and VXUS).
That lasted until September and October, when they were sold and replaced with IWC, the Microcap Index, and again purchased IVW. Though we earned profits in IEV and VXUS, they lagged the funds we had just sold, and coupled with our risk models lagging, it contributed to the disparity. As noted above, a similar switch to international exposure just took place, so we’ll have to see if this year the relative strength continues.
Our sector and style box strategies are used for our 20% equity floor, which is our minimum exposure no matter what. I’m behind on their tracking data and will report on them in the next update so as not to hold this one up.
Speaking of relative strength, this is also at the heart of the stock strategy we began using in early 2020, with the universe of the S&P 100 to pick from. That strategy only owns the top-ranked stocks each month of the S&P 100. We also started for 2024 a similar strategy where the universe is expanded to the S&P 500. In that account, there are typically over 100 stocks each month ranked highest, and we then winnow that number down to the top 30. Based on prior hypothetical results, plus the real-time results from 2024, we’ve now switched all accounts to the S&P 500 universe going forward.
This is our most aggressive strategy. It is fully invested at all times, with no defense. In 2025, net of our fees, the account gained 3.60%, lagging the Vanguard S&P 500 Fund at 17.71%. We now have over 5 years of real-time results, and it’s been quite encouraging, even with the setback on a relative basis last year. Our account has compounded at 16.57% versus 15.3% for the benchmark. Given how difficult it is to beat the S&P 500 over long periods of time, this is encouraging. A note. This process owns the top momentum stocks. Daily watching is not recommended. We’ve seen daily changes in the accounts of 5%, up and down. This is partly why we phase money into this strategy over a period of typically one to two years, rather than all at once. We’ve only had one really negative year in the past five, and we know this will suffer when the next bear market comes and stays for awhile. Meanwhile, we look to add to our own account during periods of drawdown during the year.
Below is the performance, net of management fees, of TABR’s six different portfolios at present. These represent a majority of the strategies we are using in client accounts, but not all. The differences are mainly attributed to risk (example–moderate allocation versus conservative allocation or aggressive) and account size. The numbers are for the time periods of the past year, the past 5 years and 10 years (if applicable) in accordance with SEC performance reporting requirements. We’ve also provided appropriate benchmarks for each strategy.
| Type Of Account/Strategy | 2025 Return | 5 Years Ended 2025 (or since inception) | 10 Years Ended 2025 (or since inception) |
| TABR Tactical Moderate | 12.54% | 4.83% | 5.00% |
| Moderate Benchmark (41.25/13.75/45)* | 14.78% | 6.40% | 7.90% |
| TABR Tactical Conservative | 7.13% | 3.61% | 4.09% |
| Conservative Benchmark (26/9/65)** | 12.53% | 4.60% | 6.40% |
| TABR Bond Account | 4.66% | 2.19% | 3.00% |
| Bond Benchmark (Vanguard Total Bond VBMFX) | 7.17% | -0.41% | 2.00% |
| TABR Passive Index Mix (Moderate) | 12.21% | 4.98% | 6.61% |
| TABR Tactical Stock (100% stock/tactical) | 8.26% | 7.03% | 8.54(since 12-14-18) |
| Tactical Benchmark (75/25)*** | 20.77% | 11.90% | 15.0%(since 12-14-18) |
| TABR Relative Strength OEX S&P 100 | 3.60% | 16.57% (since 2-24-20) | n/a |
| Relative Strength Benchmark (VFINX ) | 17.71% | 15.3% (since 2-24-20) | n/a |
| Vanguard Total Stock Market Index (VTSMX) | 17.12% | 13.06% | 14.24% |
| Vanguard Total International Stock Index (VGTSX) | 32.18% | 7.93% | 8.51% |
Note–all returns cited include reinvested dividends.
*consists of 41.25% Vanguard Total Stock and 13.75% Vanguard Total International Stock and 45% Vanguard Total Bond
**consists of 26% Vanguard Total Stock and 9% Vanguard Total International Stock and 65% Vanguard Total Bond
***consists of 75% Vanguard Total Stock and 25% Vanguard Total International Stock
Material Of A Less Serious Nature
At a wedding ceremony when the pastor said, “speak now or forever hold your peace,” the moment of silence was broken by a young beautiful woman carrying a child. She stood up and started walking slowly toward the pastor.
All hell broke loose. The bride threw the bouquet on the floor and burst out crying. The groom’s mother fainted. The best man fidgeted, wondering how to save the situation.
The pastor said to the woman, “Why have you come forward? What do you have to say?”
There was absolute thundering silence in the church as the woman replied, “We can’t hear in the back.”
As always, thank you for your trust and confidence in all of us at TABR, and for allowing us to serve you. Here’s wishing you a great 2026.
Sincerely,

Bob Kargenian, CMT
President
TABR Capital Management
TABR Capital Management, LLC (“TABR”) is an SEC registered investment advisor with its principal place of business in the state of California. TABR and its representatives are in compliance with the current notice filing and registration requirements imposed upon registered investment advisors by those states in which TABR maintains clients. TABR may only transact business in those states in which it is notice filed, or qualifies for an exemption or exclusion from notice filing requirements.
This newsletter is limited to the dissemination of general information pertaining to our investment advisory/management services. Any subsequent, direct communication by TABR with a prospective client shall be conducted by a representative that is either registered or qualifies for an exemption or exclusion from registration in the state where the prospective client resides. For information pertaining to the registration status of TABR, please contact TABR or refer to the Investment Advisor Disclosure web site (www.adviserinfo.sec.gov).
The TABR Model Portfolios are allocated in a range of investments according to TABR’s proprietary investment strategies. TABR’s proprietary investment strategies are allocated amongst individual stocks, bonds, mutual funds, ETFs and other instruments with a view towards income and/or capital appreciation depending on the specific allocation employed by each Model Portfolio. TABR tracks the performance of each Model Portfolio in an actual account that is charged TABR’s investment management fees in the exact manner as would an actual client account. Therefore the performance shown is net of TABR’s investment management fees, and also reflect the deduction of transaction and custodial charges, if any.
Comparison of the TABR Model Portfolios to the Vanguard Total Stock Index Fund, the Vanguard Total International Stock Fund, the Vanguard Total Bond Index Fund and the S&P 500 Index is for illustrative purposes only and the volatility of the indices used for comparison may be materially different from the volatility of the TABR Model Portfolios due to varying degrees of diversification and/or other factors.
Past performance of the TABR Model Portfolios may not be indicative of future results and the performance of a specific individual client account may vary substantially from the composite results above in part because client accounts may be allocated among several portfolios. Different types of investments involve varying degrees of risk, and there can be no assurance that any specific investment will be profitable.
For additional information about TABR, including fees and services, send for our disclosure statement as set forth on Form ADV from us using the contact information herein. Please read the disclosure statement carefully before you invest or send money.
A list of all recommendations made by TABR within the immediately preceding one year is available upon request at no charge. The sample client experiences described herein are included for illustrative purposes and there can be no assurance that TABR will be able to achieve similar results in comparable situations. No portion of this writing is to be interpreted as a testimonial or endorsement of TABR’s investment advisory services and it is not known whether the clients referenced approve of TABR or its services.