Wasted Time Redux. Everything Is Cyclical
In the summer of 2020, I started to use song titles for monthly headlines, to write about different topics. That month, it was Wasted Time, by the Eagles. We delved into the topic of how long it typically takes for markets to recover from losses.
That’s relevant now, and the answer to what has been happening to diversified portfolios for three years now may be surprising to investors. Many writing topics / ideas come from client questions and conversations, and this is one of them, and is very timely. In short, it might be something like, “Why aren’t I making any money when I hear the S&P 500 Index is up 17%?”
Having an understanding of what’s happened, and why, provides context for making better decisions. I believe we’re in a different environment for at least a while, and what’s happened in the past 12 years isn’t likely to repeat itself in the next 5 years or so. There’s actually income, in Fixed Income.
Everything Is Cyclical
At least in the United States, there is little doubt that stocks go up over the long term. Just look at the chart below, courtesy of Ned Davis Research (www.ndr.com). Long term, though, means different things to different people, depending on their age, and their personality/comfort to take risk. If you’re 30 years old, you have a much longer time frame than a 65-year-old. And though an average 65-year-old may possibly have another 25 years to live, many people think differently about their money when they stop working. Many factors come into play–how much is on the balance sheet, and where does the income come from? Pensions and Social Security are guaranteed, while stock and bond portfolios are not. Historically, though, balanced portfolios over time have done much better than guaranteed investments. But, that doesn’t mean one makes progress every year. Again, look at the chart below.

This is a chart of the Dow Jones Industrial Average, going back to the early 1900s. You’ll notice I didn’t even highlight the 1925-45 period, when stocks crashed during the Great Depression. Stocks went sideways for nearly 20 years starting around 1965, and most indexes were lower at the end of 2008 than they were at the end of 1999. As the chart shows in the mode box in the upper section of the chart, stocks as measured by the Dow Jones Industrials have spent about 40% of their time historically recovering from losses. And that’s where we stand now, with most stock indexes having peaked in January of 2022. Stocks, however, aren’t the only investment in client portfolios. At least not ones that are diversified. More on that below. It’s typical that bonds (or fixed income) make up 25% to 60% of portfolios, depending on the aggressiveness or conservatism of the investor/client. As you’ll see below, being in bonds the last three years has been harmful. Why?
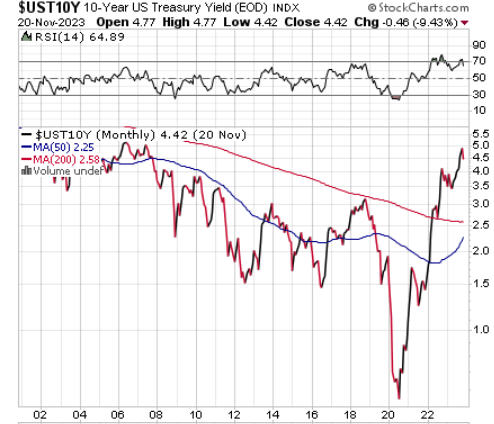
Above is a monthly chart plotting the 10-year Treasury Yield going back to around 2002. The chart is courtesy of www.stockcharts.com. The last time yields were in the 5% range was in 2006-07, and that area was breached just a couple of weeks ago, with yields dropping over 50 basis points since then. Reminder. When yields fall, bond prices rise, and inversely, when yields rise, bond prices fall. From early 2018, yields plunged from 3.2% to the all-time low of 0.49% in early 2020, associated with the Covid pandemic. From that low, yields in just over 3 years have gone up by a factor of nearly 10. This has had a very negative effect on intermediate bond funds, and the vast majority of bonds and bond funds of many varieties. To make that point with more context, and to lead you where I’m going, below is a chart showing the annual returns of a standard 60/40 stock/bond mix, going back to 1950, as provided by J.P. Morgan Asset Management.
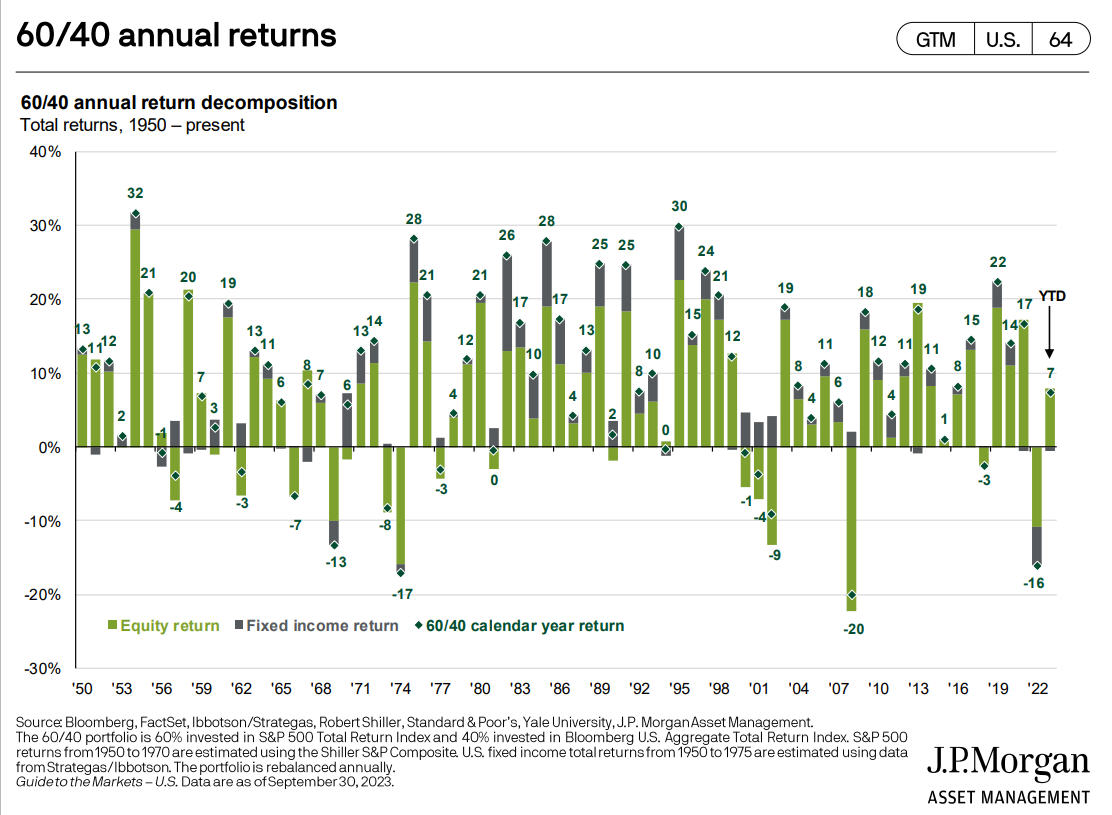
You’ll note that the return in 2022 of -16% was the third worst in history going back to 1950. When you lose -16% and then gain 7%, it’s pretty evident you’re not back to even. Plus, the above data is based on two simple indexes—the S&P 500 Index and the Bloomberg Bond Index. That’s not nearly as diversified as the 60/40 portfolio we created a number of years ago, using Vanguard funds and indexes. Below is a breakdown of the performance of each fund/allocation in our Passive Index Mix, using the annual returns from 2021 and 2022, and the year-to-date returns through November 17, 2023.
Our allocation consists of 13% to the Vanguard Large Cap Index (VV), 12% to the Vanguard Midcap Index (VO), 12% to the Vanguard Smallcap Index (VB), 15% to the Vanguard Total International Fund Index (VXUS) and 7% to the Vanguard Real Estate Index (VNQ). That’s the 60% allocated to equities. The 40% to bonds/fixed income consists of 20% to the Vanguard Total Bond Index (BND), 10% to the Vanguard Inflation-Protected Securities Fund (VIPSX) and 10% to the Vanguard High Yield Fund (VWEHX).
| Fund/Strategy | 2021 | 2022 | 2023 YTD Thru 11-17-23 | Cumulative Return |
| Vanguard High Yield VWEHX | 3.68% | -9.06% | 6.58% | +0.49% |
| Vanguard Inflation Pro Bond VIPSX | 5.56 | -11.95 | 0.39 | -6.69 |
| Vanguard Total Bond BND | -1.86 | -13.11 | 0.90 | -13.95 |
| Vanguard Large Cap Index VV | 27.40 | -19.90 | 19.99 | 22.44 |
| Vanguard Mid Cap Index VO | 24.69 | -18.72 | 6.23 | 7.66 |
| Vanguard Small Cap Index VB | 17.56 | -17.54 | 5.76 | 2.52 |
| Vanguard Real Estate Index VNQ | 40.52 | -26.24 | -1.11 | 2.49 |
| Vanguard Total Int’l Index VXUS | 9.00 | -16.09 | 9.36 | 0 |
| TABR Passive Index Account | 12.3 | -16.8 | 5.25 | -1.66 |
| TABR Tactical Moderate Account | 7.8 | -8.1 | 0.22 | -0.71 |
| TABR OEX Stock Strategy | 28.0 | -16.8 | 19.5 | 27.26 |
*TABR account data is net of management fees
With the above, now one has some context. In the Passive Index account which we operate in real-time, 40% of the account (bonds) has lost money for the past three years. International stocks have been flat, with small, midcap and real estate barely up. Only large caps have gained ground, up over 22%. One could certainly argue that we have too much in small and mid cap stocks relative to large, at 24% vs 13%, and that could be valid. With perfect hindsight, this should be in more balance, with say 19% in large stocks and 18% split between small and midcaps. However, I would not think this is a time to change that, with large cap stocks very high in relative performance to small stocks. There’s such a thing called mean reversion, and we do feel that will happen at some point. The same is true of including international stocks. They have been a drag on performance for a number of years. By the way, the data above from J.P. Morgan does not include any allocation to international stocks. Nor is there any allocation to small or mid-sized stocks.
Everything Is Cyclical
The point here is, that for fully diversified portfolios, the last three years have been dead money. This is not unique. I can tell you, from reviewing client portfolios in a variety of 401 (k) workplace accounts, those returns have been slightly better, or worse, and that’s dependent on how much stock allocation has been used, the type, and the type of bond funds invested in. Don’t make the mistake of thinking your 401 (k) account has been growing for three years, by confusing the total value with investment results. One needs to factor out contributions. Just a small, but very important detail. The passive strategy has lost -1.66% during the nearly 3-year period, while our Tactical Moderate strategy is down less than 1%, the big difference being that the drawdown of the Tactical strategy was -8% vs nearly a -17% drop for the passive account. In response to a recent question/comment from a client about possibly our models being broken, the evidence really isn’t there. They’ve done what they’re supposed to do—trying to match the market with much less downside. In hindsight, the only way to have done better than the market the past three years has been to be 100% invested in large cap stocks (but you better have been in the right ones).
Our OEX Stock Strategy has actually achieved that feat, but it entails more risk. Just as we continue to feel it’s important to diversify portfolios between stocks and bonds, it’s certainly also appropriate to diversify strategies to some extent, depending on the comfort level of each client. And, we’re bringing this topic up on a regular basis.
The initial reaction from many after learning the above might be something like, “We’ve got to do something different. This isn’t working.” That might be tempting, but it’s usually the wrong thing to do. One does not achieve the long-term results shown in the chart above of the 60/40 allocation by fiddling with the process every few years. As somebody once said, “If it isn’t broke, don’t fix it.” I’m not convinced it’s broken. Though bonds have been terrible the last three years, and even the last 10 years, that’s Hindsight Capital Management. From here, bond yields are the most attractive in over 15 years, so one should expect reasonable, positive returns from this area going out the next several years, barring a substantial rise in yields from current levels.
For instance, at present, the weighted average yield to maturity of Vanguard Total Bond is currently 5.33%, and is 4.71% for Vanguard Inflation Protected, and is 7.79% for Vanguard High Yield. Within the investment grade sector, going out two and three years, we can get gross yields in the 5.6% to 5.8% range. On a risk-adjusted basis, this is a no-brainer. On a pure return basis, I even think there is a high probability that bonds may beat stocks going out five years or more. Take a look at the following.
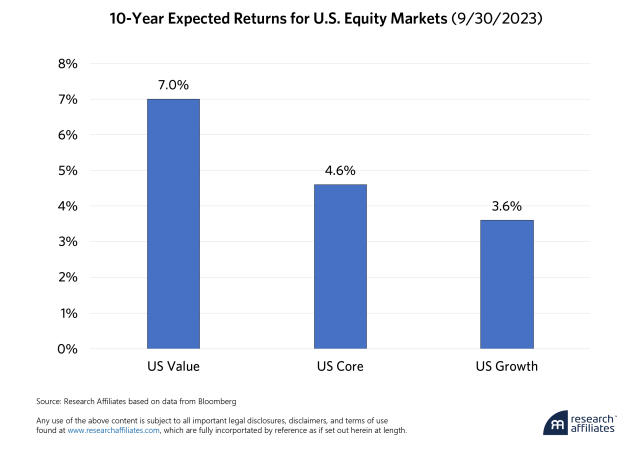
Above is the 10-year forecast for nominal returns for U.S. stocks, based on a model from Research Affiliates, the firm based in Newport Beach, CA, who has collaborated with PIMCO Funds on many products. Big caveat. A number of firms put out projections such as these. None of them publish results as to how their past forecasts have turned out. Nobody can forecast accurately, and no models are perfect. I can tell you that Vanguard and J.P. Morgan have similar forecasts, which are in the 4-6% range, and then there are the two outliers, Grantham Mayo and John Hussman, both of whom are projecting U.S. stocks will lose money during the next 7 to 10 years. For the sake of argument, let’s say the 4-6% range is reasonable. If I can get 5.6% to 5.8% going two to four years out in investment grade, that is potentially better than stocks, with much less uncertainty. Believe me, this has not been lost on us, and will be reflected in our year-end rebalancing work, where we expect to have a significant portion of our fixed income exposure locked in for several years.
Dead Money
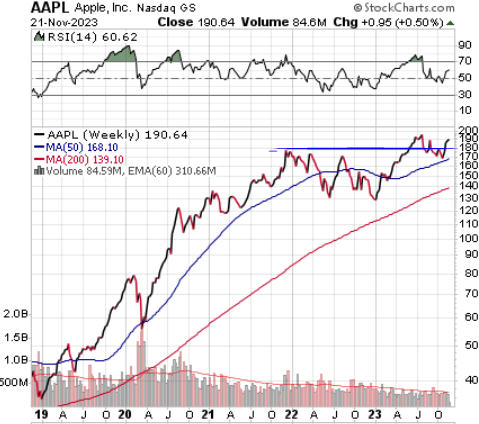
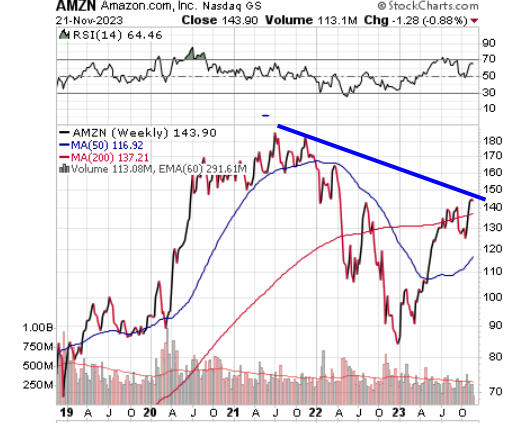
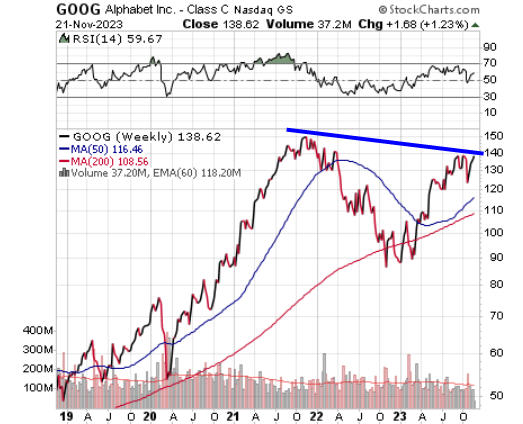
The visuals above, and the data, do explain what I’m trying to get across, but they say a picture is worth a thousand words, so I thought several charts would better illustrate what has been happening. It’s been well chronicled that the S&P 500 has been top heavy for several years. Today, the top 10 companies account for 30% of the value of the index. A bull market is usually best when gains are broad, across all spectrums, large, small, mid caps and foreign. That’s not been the case. Below are charts of four of these behemoth companies—Apple, Amazon, Google and Tesla. There are others, but there’s only so much room in this piece. All charts are courtesy of www.stockcharts.com.
Apple
Amazon
Tesla

Of the four shown, which are part of the largest 7 stocks in the index, only Apple is above its late 2021 high. And that’s nominally. Nvidia and Microsoft have also exceeded their 2021 highs, while Meta (the former Facebook) is about 10% lower than its high. Google is also almost 10% lower, while Amazon is 20% off its high. Tesla is the most extreme of the 7, now down -41% from its high. When you look at the entire index of the S&P 500, on a total return basis, it peaked on January 3, 2022, and is currently -2.66% below that level (total return means dividends are reinvested). In contrast, the S&P 600 Smallcap Index is down -18% from its high.
From a valuation standpoint, the big 7 currently trade at an average price/earnings multiple of 41, compared to 15 for the equal-weighted S&P 500 P/E, according to Richard Bernstein Associates. This is partly why in the model above from Research Affiliates, value stocks going forward are expected to do better than growth stocks. I forgot to mention this above, but in the same modeling study, Research Affiliates expects international and emerging markets indexes to earn 9-10% annually going out 10 years, double the expected return for U.S. core indexes. Just an FYI—we do not use fundamental valuation work in any of our fund selection or stock selection models. They are all based on momentum, or relative strength, and though we do believe valuations matter in the long run, our actual TABR accounts have been concentrated since July all in large company indexes. I don’t really trust models that have attempted to forecast future returns in international equity markets. They showed similar projections back in 2009, and they have been dead wrong. If and when international stocks begin to lead our rankings, we’ll own them, and that’s true for small and mid cap stocks as well, whether it be growth or value.
T + 1 Settlement
A quick regulatory note. In the United States, the Securities Industry currently follows a T+2 settlement cycle (trade date plus 2) for equities and fixed income and ETFs. Mutual Funds are T+1. Everything will be moved to T+1 effective May 28, 2024. That will be nice that all assets will settle on the same cycle going forward.
Tax & Savings Contribution Limits News
In early November, the IRS announced new tax brackets and contribution limits for a variety of retirement plans and gifting. Due to inflation adjustments, the threshold for the top federal income tax bracket in 2024 will increase by nearly $40,000. Then, the 37% income tax rate will apply to income above $731,200. For individuals, it starts at $609,350.
The limit to contribute to a 401 (k) plan is bumped to $23,000, and for those 50 and up, a catch-up of $7,500 can me made, making the maximum $30,500. For a regular contributory IRA, the limits are $7,000 and $1000 for the catch-up. For those who use their IRA accounts to give to charity and have it count toward their minimum distributions, the maximum amount was raised to $105,000, up from the $100,000 limit which had been unchanged for many years.
The exclusions for estate and gift taxes were also announced, with the exclusion regarding estate taxes increased to $13.61 million for those who die in 2024, and the annual gift tax exclusion increasing to $18,000 per person.
Portfolio Allocations
Since October 10, our risk models for stocks have been quite active, first giving two sells, followed by two buys in the past week, getting tactical accounts back to 50% invested on the equity side. At present, 3 of 6 models are positive, and a fourth will likely go positive any day, pushing us up to around 66%. In addition, our risk model for high yield bond funds flipped back to a BUY signal on November 6. All in all, the evidence which was quite negative just three weeks ago, has reversed rather quickly.
Our last update published on October 30 was titled, “Can Seasonality Save The Stock Market?” Indeed, it has, with the S&P 500 up 8.22% during the first 21 days in November, and the Nasdaq 100 up an even stronger 10.57%. With such a strong start from the oversold condition which was created in late October, it’s worth asking, will there be anything left the rest of the year, even though December is typically a strong month?
A very bullish development took place on November 3, when a “breadth thrust” took place, using criteria developed by analyst and newsletter writer, James Stack. Stack measures the difference between 5-day advances and 5-day declines. There have been 40 prior cases since 1950, and after one year, 38 of the 40 showed positive returns, with median gains of 20.5% versus a median for all periods of 9.74%. The two losses which occurred were both less than 1%.
There are no guarantees with any prior study, but that’s an encouraging sign for market strength possibly well into 2024.
A Quick Kid’s Update
Our daughter Caroline is in her first semester at Cal Poly San Luis Obispo, majoring in Animal Science, and loving it. She joined the Dressage team, and just a few weeks into school, competed at Stanford. That’s her below on the far right.

And, below, she celebrated being accepted into the Delta Gamma sorority. Looks like she’s having a good time, yes? That’s her below, on the right. We get her this week for Thanksgiving, then back to school it is.

As for son Adam, this photo below pretty much tells it all.

Adam did all the art and photo work for Kid Laroi’s new album which dropped two weeks ago, and this billboard in Times Square promoting one of the singles was part of that. Pretty cool stuff, to say the least.
Material Of A Less Serious Nature
There once were twin boys, age six, who had developed extreme personalities. One was a pessimist and the other a total optimist. Concerned, their parents took them to a psychiatrist.
First, the psychiatrist treated the pessimist. Trying to brighten his outlook, the psychiatrist took him to a room filled with shiny new toys. But instead of yelping with delight, the little boy burst into tears. “What’s the matter?” the psychiatrist asked. “Don’t you want to play with any of the toys?”
“Yes,” the little boy bawled, “but if I did, I’d only break them.”
Next, the psychiatrist treated the optimist. Trying to dampen his outlook, the psychiatrist took him to a room piled to the ceiling with horse manure. But instead of wrinkling his nose in disgust, the optimist climbed to the top of the pile, and began gleefully digging scoop after scoop with his bare hands.
“What are you doing?” the baffled psychiatrist asked.
The little boy replied, “With all this horse $hit, there must be a pony in here somewhere!”
May you have a blessed Thanksgiving. Despite all that goes on in the world, there’s much to be thankful for here. As always, we appreciate the trust and confidence you place in all of us at TABR. Don’t forget to watch Thursday night. Hopefully my Niners put a PURDY good whoopin’ on the despised Seahawks.
Sincerely,

Bob Kargenian, CMT
President
TABR Capital Management, LLC (“TABR”) is an SEC registered investment advisor with its principal place of business in the state of California. TABR and its representatives are in compliance with the current notice filing and registration requirements imposed upon registered investment advisors by those states in which TABR maintains clients. TABR may only transact business in those states in which it is notice filed, or qualifies for an exemption or exclusion from notice filing requirements.
This newsletter is limited to the dissemination of general information pertaining to our investment advisory/management services. Any subsequent, direct communication by TABR with a prospective client shall be conducted by a representative that is either registered or qualifies for an exemption or exclusion from registration in the state where the prospective client resides. For information pertaining to the registration status of TABR, please contact TABR or refer to the Investment Advisor Disclosure web site (www.adviserinfo.sec.gov).
The TABR Model Portfolios are allocated in a range of investments according to TABR’s proprietary investment strategies. TABR’s proprietary investment strategies are allocated amongst individual stocks, bonds, mutual funds, ETFs and other instruments with a view towards income and/or capital appreciation depending on the specific allocation employed by each Model Portfolio. TABR tracks the performance of each Model Portfolio in an actual account that is charged TABR’s investment management fees in the exact manner as would an actual client account. Therefore the performance shown is net of TABR’s investment management fees, and also reflect the deduction of transaction and custodial charges, if any.
Comparison of the TABR Model Portfolios to the Vanguard Total Stock Index Fund, the Vanguard Total International Stock Fund, the Vanguard Total Bond Index Fund and the S&P 500 Index is for illustrative purposes only and the volatility of the indices used for comparison may be materially different from the volatility of the TABR Model Portfolios due to varying degrees of diversification and/or other factors.
Past performance of the TABR Model Portfolios may not be indicative of future results and the performance of a specific individual client account may vary substantially from the composite results above in part because client accounts may be allocated among several portfolios. Different types of investments involve varying degrees of risk, and there can be no assurance that any specific investment will be profitable
For additional information about TABR, including fees and services, send for our disclosure statement as set forth on Form ADV from us using the contact information herein. Please read the disclosure statement carefully before you invest or send money.
A list of all recommendations made by TABR within the immediately preceding one year is available upon request at no charge. The sample client experiences described herein are included for illustrative purposes and there can be no assurance that TABR will be able to achieve similar results in comparable situations. No portion of this writing is to be interpreted as a testimonial or endorsement of TABR’s investment advisory services and it is not known whether the clients referenced approve of TABR or its services.