What A Fool Believes
In general, I suspect that most men would agree (if they’re being honest) it’s usually not a wise thing to do the opposite of a wife’s or girlfriend’s advice. Even if such advice was unsolicited (as you’ll see in this case).
So, it is with trepidation that I give you this month’s headline as one of the best descriptions I can find about today’s investing environment. From some reading I was doing last summer, I realized that whoever says the most stuff in the fewest words would be more effective as a writer. Something popped into my head that song titles would be perfect to describe what’s going on. Most are short and sweet.
And, usually, I can find something in the lyrics that apply to what I want to convey. But after December’s Do You Feel Like We Do? ode to Peter Frampton, my wife volunteered something like “Hey, that was a novel idea but it’s run its course. You should move on.”
Ouch. Here I have unlimited future ideas from the Eagles, Boston, Chicago and others, but I’m supposed to go back to things like “Stock Market Breadth Suggests All Is Good” versus “Does Anybody Really Know What Time It Is?” Yikes.
With great personal risk, I present you a few lines from the 1978 hit from the Doobie Brothers, “What A Fool Believes.”
But what a fool believes he sees
No wise man has the power to reason away
What seems to be
We’ll relate this to current market behavior, along with some comments on Stocks & The Blue Wave, Steve Gleason and a look back at 2020. Read on.
Speculation, Stupidity Or Smart?
The above could certainly have been this month’s headline, and I wouldn’t have risked the wrath of my wife. But, hey, you only live once (and, maybe, not for long).
A lot of things unimaginable have been happening since last February. First, stocks as measured by the S&P 500 Index plunged over 34% in just a tad over one month, but since the low on March 23, have rebounded 71%. Stocks are basically at all-time highs concurrent with some of the worst news on the Pandemic, with lockdowns continuing and ICU beds across the nation mostly full.
Markets tend to look ahead, and would seem to be saying that in perhaps 5 to 8 months, the U.S. might have 150 million people inoculated and life as we knew it will be getting back to normal, with kids at school in person full-time, more people on planes and in hotels, traveling, going to Disneyland, sporting events, concerts, movies, and eating out with restaurant owners not having to worry about health department officials shutting them down for dissing state guidelines.
From my personal experience with investing, now going on 38 years, the last few months are feeling like the market will never go down. Speculation appears rampant, in many areas, fueled by an easy money Fed, technology that didn’t exist 20 years ago (the cell phone in its current stage), and social networks that seem to create herds of behavior (think Reddit). As noted previously in prior updates, we’re now seeing initial public offerings double on their first day (amid very little substance), capital being raised in record amounts for SPACs (special purpose acquisition companies, where you give your money to a money manager without knowing anything about what they will do with it), and, lest I forget, Bitcoin mania.
Witness the table below, where I’ve listed the performance just since Halloween of four major stock indexes, plus three stocks along with Bitcoin.
| Index/Stock | October 31, 2020 | January 22, 2021 | Net Change |
| S&P 500 Index | 3270 | 3841 | +17.4% |
| Nasdaq 100 Index | 11,053 | 13,366 | +20.92% |
| S&P 600 Smlcap Index | 72.02 | 101.16 | +40.46% |
| EFA Index (foreign stks) | 61.39 | 75.15 | +22.41% |
| Tesla (TSLA) | 388 | 846 | +118% |
| Gamestop (GME) | 10.47 | 65.01 | +520% |
| Sunworks (SUNW) | 2.82 | 22.90 | +712% |
| Bitcoin | 13,750 | 31,730 | +130% |
Especially with the broader indexes, these gains would be outstanding in one year, let alone three months, and there has been some valid reason behind the scenes. We’ve had the announcements of successful vaccines by Pfizer and Moderna in early and late November, coupled with President Biden being elected, so there are thoughts of more and more spending, which has caused interest rates to rise, and small companies rising disproportionately based on a recovering economy.
Tesla has been derided for years, and its actually the smallest of the gainers of the 4 other comparisons we’ve listed. When you widen the time span, Tesla stock has been like the rocket ships launched by its sister company SpaceX. Since March 18 of last year, when it closed at 72, the stock is up 1075%.
Is that justified? Not if you believe the fundamental case, but I don’t think Tesla has ever been about fundamentals. Looking at fundamentals has kept most value-0riented investors from buying the stock. Only recently has the company become profitable on a year-over-year basis, which is the main reason the stock was only recently added to the S&P 500 Index in December 2020, AFTER its huge advance.
Look at the chart below, courtesy of Research Affiliates in Newport Beach, CA. It compares the market cap of Tesla to the nine largest car manufacturers in the world—Toyota, Volkswagen, Renault-Nissan, General Motors, Hyundai-Kia, SAIC, Honda, Ford and Fiat Chrysler.
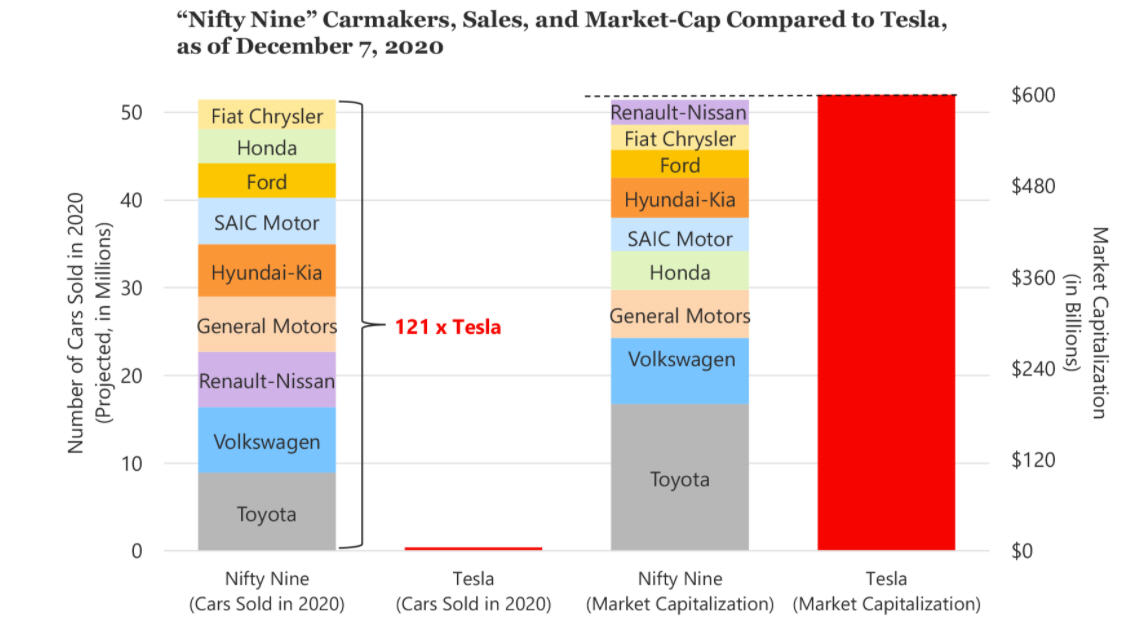
At current valuations, one could buy all nine of the other companies combined, and still have $billions left over. Moreover, the other nine companies sold 121 times more vehicles in 2020 than Tesla. Does that make sense? Of course not, but making money and making sense in markets don’t always equate. I also want to give full disclosure here. In a new strategy I am testing with my own money, and now are just starting to share with clients, we’ve owned Tesla since January 4 and its up 15% in 18 days. Our process is pure technical analysis, and we would have owned it at certain points during 2020 but it was not part of the S&P 100 Index at that time, and therefore was not part of the universe of stocks that we are screening. I should also note that several clients own Tesla, and have made some serious money investing in the stock. That is to their credit, and not ours. It’s their idea, and their game plan.
Where the stock goes from here I have no idea, but at least they have a magnificent product with a founder in Elon Musk who has unbelievable vision and talent. But, GameStop and Sunworks? Let’s examine them.
You’re probably familiar with Game Stop, the videogame retailer, both new and used, that has commonly been found in indoor retail malls. Need an XBox? Go to Game Stop. Apparently, though, there aren’t enough professional athletes and college-aged young men even with quarantines, to buy enough product to make the company consistently profitable. For some perspective, the stock hit $40 back in 2013, and began a gradual descent the past 7 years, plunging to below $3 in early April of 2020. See the chart below, courtesy of www.stockcharts.com
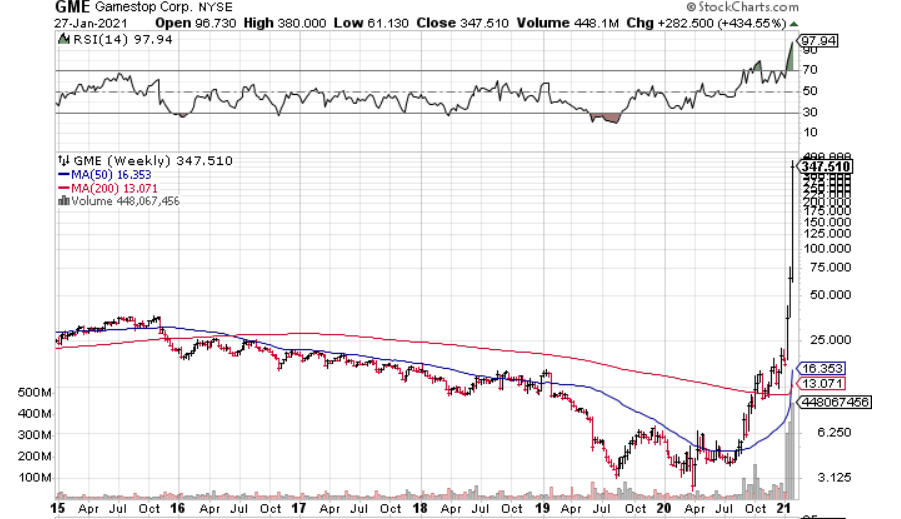
The stock traded between $3 and $5 until late August, when on two consecutive days, it surged above $7 on volume of over 60 million shares combined, when normal daily trading volume was running around 2 million shares. By September 22, the stock had cleared $10. Then, on October 8, it surged 42% in one day on 77 million shares to close over $13.
That day, according to Wikipedia, GameStop announced an agreement with Microsoft to migrate backend systems to Microsoft 365 platforms including Dynamics 365, also including in-store usage of Microsoft Surface products by employees.[78] It was later reported that this agreement would also include revenue sharing on all digital game purchases for Xbox Series X and S for each product sold by the retailer, although the exact percentage of this share was not disclosed.[79]
This, of course, was a positive fundamental development, but what’s really propelled the stock is a classic short squeeze. As recently as December 14, the stock was below $13, but rose to almost $20 on January 12. Then, the doors blew off, with the stock surging 50% on 144 million shares to $31, and last Friday, January 22, gaining yet another 50% to over $65 on 177 million shares. Since creating the table above and writing this over the weekend, Game Stop has since risen from $65 last Friday to $347 today. That’s not a misprint. It’s now gained over 3300% in less than 4 months.
It turns out Game Stop has been one of the most heavily shorted stocks in the entire stock market, with over 100% of the stocks’ float in short positions. A stocks float represents the number of shares available. In a short squeeze, there is a rapid rise in the price of a stock due more to technical factors than fundamentals, and is driven by excess demand and a lack of supply. Short sellers are betting a stock will decline in price, usually due to the fact they think the fundamentals of a company are poor and not supportive of the stock price.
A short seller can only make 100% on their money. But, if they are wrong, they can lose infinite amounts on the upside. And, this appears to be what is happening with Game Stop. Let’s say a short seller sold the stock short at $5. The best they can do is make $5 per share, and that is only if the company goes bankrupt. But, if they are wrong, the stock can go up as high as traders and speculators will take it, and if one is short and does not cover their position by purchasing the stock back, the losses just mount and mount. Here, in real life, Game Stop stock has gone from $5 to over $347 in a matter of months. It’s probably not justified. But, it’s happened. And, it’s been aided by stock trading chat rooms such as Reddit where the vilification of opposing views has reportedly been quite scary.
Tesla, by the way, has been the scorn of short sellers for several years, and this has cost them literally $billions of dollars, with most of that being in the last 12 months. If these were isolated events, that would be one thing. They’re not. Like me, you’ve probably never heard of Sunworks. I hadn’t either, until last Wednesday, when a client called and purchased 100 shares at just over $15. They sold it on Thursday for over $19. On Friday, it closed at just under $23. Yes, in three days. But, look at the chart below, again courtesy of www.stockcharts.com.
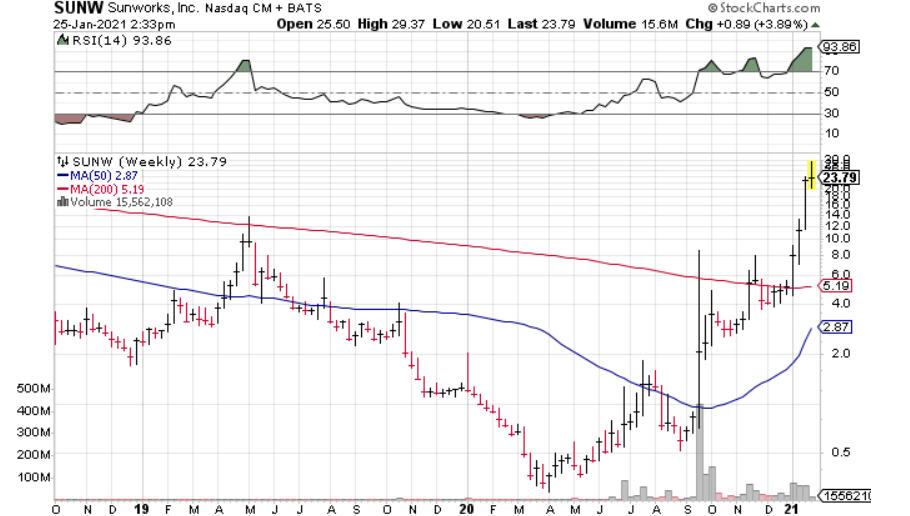
On September 24, the stock went from $1.16 to nearly $4 on 267 million shares of volume, with no news. Sunworks is a small solar company based in Roseville, CA which hasn’t made money in over 5 years. Annual revenue in 2016 was $86 million, dropping to $59 million in 2019. As recently as September 2020, shareholder equity was $5.26 million while total liabilities were over $16 million. So, why the craziness?
Almost all solar related stocks have been soaring since the election, on speculation over potential “green” policy changes by President Biden. As recently as December 14, Sunworks traded below $4, and just 6 weeks later has gained over 470%.
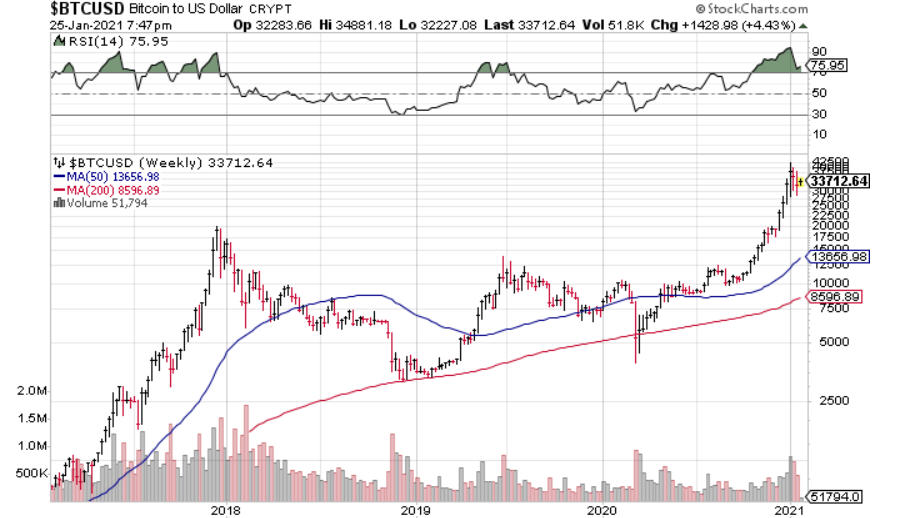
Finally, there’s Bitcoin. In our March 2019 monthly update, here’s a bit about what I wrote about Bitcoin.
Hey Honey, Our Retirement Savings Are Gone. They’re In Some Guy’s Computer, He Died, And Nobody Has The Password
The only thing sadder about the above headline is that it’s true. According to a story in the Wall Street Journal back in February, stockholders in a Canadian cryptocurrency exchange say about $136 million worth of customers’ holdings are stuck in an electronic vault because the company’s founder, and sole employee, died without sharing the password.
There’s a reason why we’ve not written one word (up to now) about Bitcoin. It’s not a legitimate investment, and likely never will be. It’s about as legitimate as investing in Tulips in the 1600s. It’s pure speculation. In the next paragraph, you’ll see all you need to know about investing in Bitcoin and other so-called cryptocurrencies.
BLANK SPACE. Meaning, I intentionally left the space below blank.
At that time, Bitcoin was trading around $4,000 per coin, down from over $20,000 in December 2017. See the chart below. Today, it sits around $33,700, so it has appreciated some 740% in less than 2 years. Sounds like Tesla. Except that Tesla actually makes real cars and is a real company. Bitcoin exists inside people’s computers, from “mining” them, and the stories about people losing their passwords and fortunes in the hundreds of $millions continues to be true today.
So, absolutely, I’ve been wrong about the price, but my view that it is total speculation has not changed at all, even with Wall Street now attempting to make cryptocurrencies “legitimate” and a “new asset class.” Even Fidelity Investments, the custodian for our clients’ accounts, has put out a white paper and created a separate division to deal in this area. Today, there is an ETF called the Grayscale Bitcoin Trust, symbol GBTC, which is solely and passively invested in Bitcoin, allowing speculators to gain exposure to it without the hassles of buying, storing and safekeeping it directly (no lost passwords). The expense ratio on this Trust is 2% annually, which is exorbitant. Soon, a new ETF will be out that does the same thing for an expense ratio of 0.49%.
Recently, Alex Pickard of Research Affiliates penned a piece called Bitcoin: Magic Internet Money. My thinking aligns with his, where he wrote: “Bitcoin, like gold, is a vehicle for speculation. It is not a vehicle for investment, not a store of value, and not an inflation hedge. BTC is not a capital asset: it does not generate cash flows derived from economic returns on capital. Its extreme volatility invalidates claims of a reliable store of value and calls into question any inflation-hedging properties.”
Ultimately, what I’m observing about the stock market and Bitcoin right now was summed up in a quote this weekend from a Bloomberg article on Bitcoin. A 23-year-old Atlanta woman said, regarding her purchase of Bitcoin: “I didn’t do too much research. I was just thinking, ‘Let me just get in there any way I can,'” she said. “I just wanted to be a part of it.”
If you do want to learn about Bitcoin, I’m not the one to explain it to you. My rule of thumb is that we don’t recommend investments to clients unless we have our own money invested in them (skin in the game). About the only exception I can think of might be an annuity that is suitable for a client, but not for us. However, I did find an extremely thorough guide to Bitcoin, that was recently published by the CFA Institute, and a link to that is below.
https://www.cfainstitute.org/-/media/documents/article/rf-brief/rfbr-cryptoassets.ashx
Finally, I came across this nugget from Benjamin Graham’s Intelligent Investor, writing about the New Era.
“The notion that the desirability of a common stock was entirely independent of its price seems incredibly absurd. Yet the new-era theory led directly to this thesis. If a public-utility stock was selling at 35 times its maximum recorded earnings, instead of 10 times its average earnings, which was the preboom standard, the conclusion to be drawn was not that the stock was now too high but merely that the standard of value had been raised. Instead of judging the market price by established standards of value, the new era based its standards of value upon the market price. Hence all upper limits disappeared, not only upon the price at which a stock could sell, but even upon the price at which it would deserve to sell.
“An alluring corollary of this principle was that making money in the stock market was now the easiest thing in the world. It was only necessary to buy “good” stocks, regardless of price, and then let nature take her upward course. The results of such a doctrine could not fail to be tragic. Countless people asked themselves, “Why work for a living when a fortune can be made in Wall Street without working?”
As the Wall Street Journal’s Jason Zweig wrote, “Investing can be simple, but it isn’t easy. It isn’t a mindless joyride. It is a process, not a game; you win by persisting over the course of many years, not by racking up the most points in the least amount of time.
What A Fool Believes is a very appropriate title at this juncture. We’ll see just how long the market can remain irrational.
Steve Gleason’s 10-Year Anniversary
In November of 2016, instead of our normal Thanksgiving book offering, we sent out a DVD of the new documentary at that time, Gleason, detailing the path of former NFL player Steve Gleason, who at that time five years earlier, had been diagnosed with ALS. He can’t move, and can only speak through a speech-generating device. This much acclaimed documentary was not so much about ALS, but rather Gleason’s love for his son, his relationship with his father, and ultimately, life. Life, which can be messy and raw.
For those of you interested, The Athletic recently published an updated piece on Gleason, who is now 10 years past his ALS diagnosis. You can find the article through the link below.
https://theathletic.com/2301281/2021/01/05/steve-gleason-als-a-day-in-the-life/
By the way, if you’re a sports junkie like myself, keeping up with your favorite teams (all of mine are outside the area except the Angels), subscribing to The Athletic is like the bargain of the century. It’s like $60 a year, and you get custom coverage of all your teams. In the “old” days, I would subscribe to the print edition of the San Francisco Chronicle just to get the local coverage of the 49ers. That was like $300 per year. Besides the big four sports leagues, The Athletic also covers college football and basketball, along with golf and soccer. Talk about an undervalued asset!
The Blue Wave—What Does It Mean For Stocks?
Though President Biden was elected in early November, in an unusual twist, control of Congress was up in the air until the conclusion of the Georgia Senate run-off elections a few weeks ago. Now, we know that Democrats control both houses of Congress along with the White House. What does that mean for the next two to four years for the stock market? Unfortunately, there have been only 10 prior cases of such a configuration since World War II, and the results are shown below, courtesy of Bespoke Investment Group.
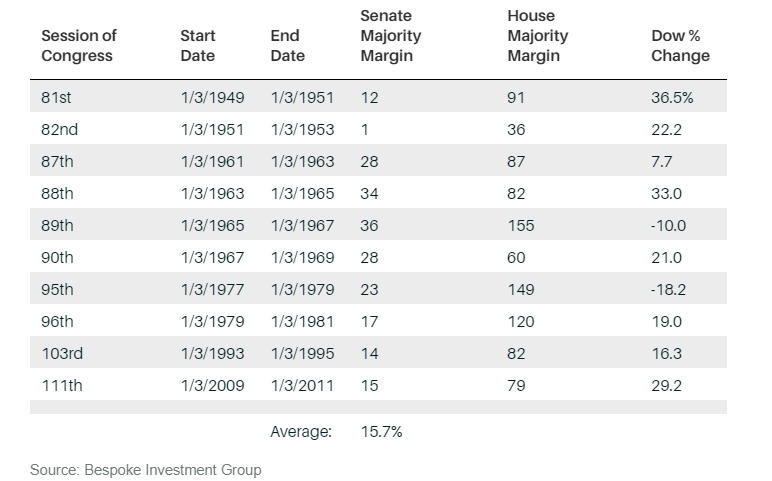
In 8 of the 10 cases, stocks were higher, with average gains of nearly 16%. Over time, stocks go up about 3 in every 4 years, so this really is not significant from a statistical standpoint. I should also note that there is no majority in the Senate, with a 50-50 split which can be decided by Vice President Kamala Harris, but only if every Democrat votes with the party line. We’ve stated in the past, and will again in the future, that one should leave their politics aside from their investments. And, this is no different. There is much speculation about what a Biden Presidency will do policy wise. He’s outlined things like raising the corporate tax rate, raising taxes on individuals who earn more than $400,000 annually, eliminating the favorable tax treatment on capital gains and dividends, lowering the estate tax exemption back down to perhaps $5 million, and also eliminating the step-up in cost basis on assets such as real estate and stocks when a person dies.
On their own, some of these items would appear to be negative for financial markets. Other priorities of Biden include an emphasis on “green, clean energy” and significant stimulus spending on infrastructure and boosting the lot of lower-income families. Some of these possibilities have already been showing up in markets the last several weeks, with interest rates rising about 30 basis points since the election, and unbelievable speculation in the stocks of solar companies (see above). The negatives are likely a ways off, if they materialize at all, especially given the focus on getting most of America vaccinated so the economy can get more fully open. The behavior in markets is the best clue, and right now, the vibe is pretty positive, with the S&P 500 up over 14% since the day before Election Day, and small stocks represented by the S&P 600 Index up over 34%. From a stock market perspective, the biggest challenge for President Biden is taking over at a point where historical valuation indicators suggest stocks are more expensive than ever before. Two years from now, we’ll look back and see if those valuation indicators really mean anything.
Portfolio Allocations—Still Fully Invested
There’s been no change in our stock market risk models since our last update right before Christmas. Stock allocations continue to be fully invested, along with our positions in high yield bond funds. Back on December 1, and again on January 4, we’ve had some relative strength changes which have dictated moves in our holdings of stock ETFs, and these continue to be helpful. In December, a position in large cap stocks (OEF) was eliminated and replaced with Microcaps (IWC) and Emerging Markets (IEMG). Then, a few weeks ago, Emerging Markets was sold along with large cap growth (IVW) and replaced with small cap core (IJR) and small cap growth (IJT). In a matter of about one month, our allocations went from all large caps to now about 64% small caps with the rest in QQQ, which is primarily large cap technology. The small cap positions alone have gained from 11% to 15% in just the last three weeks. We know this cannot continue, but it will play out until our indicators and models begin to change.
With stocks making new highs the last few days, and the number of stocks making new highs showing very little in the way of divergence, the suggestion is prices are likely to be higher in the weeks ahead. Near term, breadth measures seem to be getting sloppy, so a selloff, even one approaching 10%, could happen at any time, but until the number of stocks making new lows starts expanding, the technical evidence suggests the market is still mostly on strong footing. We’re also seeing confirmation from the high yield bond market, though gains in that area have become muted, as yields are compressed.
A Look Back at 2020
We’ve always found it useful to look backwards and contemplate what we’ve done. This can be helpful even when things seem to be going right, but even more so when they’re not. It’s how one can make course corrections, and fix things.
Transparency has been a fixture at TABR since we were founded in 2004. The vast majority of RIAs in our business do not publish a track record. They may cite compliance issues, or the work necessary to comply with regulations, or that all their clients have “customized” portfolios. Simply put, we do publish one, because we believe in our process, and our staff backs that up by investing the vast majority of their personal savings in the exact same strategies we use for clients.
Sometimes, the numbers aren’t pretty, and other times, they are great. That is part of being in investment management. Even the best money managers in the business go through years of underperformance. We are no different. The key is, in our view, sticking with your discipline, but also having the courage to fix things when something may be amiss.
And though below you will see comparisons to industry benchmarks, ultimately we are judged by helping our clients achieve their goals, with substantially less risk than passive, buy and hold strategies. Besides our combined 53 years of financial planning and investment management wisdom, that is probably the one big difference and edge we have over competitors.
Our accounts entered the year about 83% invested in stocks, and fully invested in high yield bond funds, with the latter dating back to January 2019. By March 11, equity allocations had been reduced to 20%, and high yield bonds nearly all sold, which helped to minimize losses, as stocks would go on to lose nearly -20% in the subsequent two weeks, down nearly -34% in just a tad over one month. Stocks bottomed on March 23, and in hind sight, never looked back. By year-end, the S&P 500 Index had gained nearly 70% from its low, and the S&P Small Cap 600 Index had rebounded 90%. From July 7 to year-end, tactical equity exposure was 83% or greater for all but 3 weeks, a period in which the S&P 500 gained approximately 19%.
When all was said and done, the S&P 500 Index climbed 18.25% for the year, while the S&P 600 gained 11.28%, nearly the same as the Vanguard Total International Stock Index Fund, up 11.16%. Intermediate corporate and government bonds, as measured by the Vanguard Total Bond Market Index, rose 7.61%. We’ll touch on maximum drawdowns below.
Stock Allocations
Our average equity exposure for the entire year was 69%, and there was little turnover in our relative strength selections, with just two changes the entire year. Had we been fully invested the whole year in the top three ranked ETFs which we evaluate monthly, we estimate the return would have been 33.5%, beating the benchmark of 18.44%. Clearly, our selection process continues to work quite well, and downside losses were contained quite well, as you’ll see, but our challenge was not having more exposure on the rebound, which was quick and powerful, with no re-test of the lows. By isolating our equity performance, we see the TABR Tactical Stock account gained 12.22% versus the benchmark of 18.44%, capturing 66% of the upside, where its maximum drawdown was -15.32%, compared to a -34.1% loss for the benchmark. Downside capture, therefore, was -45%. This is a good combination that we hope to improve upon.
Our Dividend Stock strategy, which I started in late 2014, had been mediocre compared to the S&P 500 through 2019. Dividend income had consistently grown at around a 9% clip, but returns lagged, and then the Pandemic exposed the weakness in the process, that of companies cutting or eliminating their dividends. I had thought that keeping some risk management in place (a 40% floor on exposure) would help mitigate the downside risks which were evident in our back-testing, but that wasn’t the case. Ultimately, we saw a -42% drawdown, and our screen managed to own everything that tanked, from Macy’s to Carnival Cruise Lines to various financial companies. Value stocks have been out of favor for nearly 11 years now, and we’d made reasonable returns until last year. Ultimately, I decided to shut the strategy down in mid-July, having learned some lessons about the process we’d developed. For the 6 plus months, the account was down -36%, while the S&P 500 was down less than -2% at that point, pretty much mirroring the differences last year between growth and value styles. We turned from earning about 6% compounded to -2.07% compounded for just over 6 years. That’s not what I was envisioning, but we can live to play another day, and will learn from it.
Our new Relative Strength S&P 100 Index strategy fared much better, earning 35.4% from its inception on February 24, nearly doubling the return of the S&P 500 at 18.12%. A brief primer. The strategy is fully invested in stocks at all times, owning only top ranked stocks each month from our relative strength screen. It uses a similar process of ranking stocks to the process we use for ranking ETFs. This is a departure from what we emphasize—risk management. The whole goal here is to beat the market (add alpha), and maximize returns. It is aggressive. It is volatile. At some point, I fully expect there will be a drawdown of at least -50%. The vast majority of our clients are Conservative or Moderate, but some of them are interested in being more aggressive with a portion of their assets. This is for them. Especially with interest rates so low. However, we’re being careful in regards to initiating positions here, as we think near-term, speculation is running rampant and markets are extended. At present, four of our eight holdings this month include Disney, Blackrock, Morgan Stanley and Tesla. We’ll post periodic updates going forward.
Speaking of a fully invested approach, that also describes our Passive Index account, which gained a respectable 10.66% for the year, using a 60% stock and 40% bond allocation. At some point, we expect this approach to lag our tactical work for more than just a few months, given stock market valuations and interest rates. But, it has its place in portfolios for those willing to stomach the greater downside in exchange for greater upside. Witness—at the March 23 low last year, this account was down -24.4% from its peak, while the TABR Moderate Risk account was down -9.75%. I’m in the middle of reading Morgan Housel’s The Psychology of Money. In one section, he writes “My own theory is, that in the real world, people do not want the mathematically optimal strategy. They want the strategy that maximizes how well they sleep at night.” That best describes our tactical work, which is the heart of who we are.
Bond Allocations
The 10-year Treasury Yield started the year at 1.92%, hit a low of 0.49% on March 9, and ended the year at 0.92%. After corporate bond prices plunged in March, with high yield corporate bond funds dropping nearly -24% from their peak and even short duration funds losing nearly -10% of their value, the Federal Reserve Board stepped in, cut the Fed Funds rate to zero over a period of weeks, then pledged to backstop almost everything and anything. This spurred a huge recovery, and the Vanguard Total Bond Market Index finished the year with a 7.61% gain, while high yield bonds gained about 5%, with some better and some worse.
For the first time in several years, our tactical work did not help us as much in the way of returns. Our models avoided the huge drawdown in high yield, but we suffered in areas we wouldn’t expect, such as PIMCO Income, short duration funds and our allocation to a 2024 defined maturity fund, BSCO. There were a couple of flaws in our process, which we’ve fixed, but we definitely underestimated the power of the Fed and how much they propped up the bond market in all areas. At its worst, the TABR Bond Account was down -8.38% from its peak, substantially better than the drop in high yield noted above, and finished the year down -1.69%. That, more than anything, hurt our overall gains more so than lagging a bit on the stock side.
Below is the performance, net of management fees, of TABR’s six different portfolios at present. These represent a majority of the strategies we are using in client accounts, but not all. The differences are mainly attributed to risk (example—moderate allocation versus conservative allocation or aggressive) and account size. The numbers are for the one year ending December 31, 2020.
| Type of Account/Strategy | 2020 Return | Benchmark |
| TABR Tactical Moderate | 4.42% | 13.01%* |
| TABR Tactical Conservative | 3.44% | 11.38%** |
| TABR Bond Account | -1.69% | 7.61%*** |
| TABR Dividend Stock | -36.39% | -1.37%**** only thru 7-13-20 |
| TABR Passive Index Mix | 10.66% | 14.10%***** |
| TABR Tactical Stock Strategy | 12.22% | 18.44%****** |
| TABR Relative Strength OEX S&P 100 | 35.41% | 18.12**** from 2-24-20 to year-end |
| Vanguard Total Stock Market Index | 20.87% | n/a |
| Vanguard Total International Stock Index | 11.16% | n/a |
| Vanguard Total Bond Market Index | 7.61% | n/a |
| Vanguard S&P 500 Index Fund | 18.25% | n/a |
*consists of 37.5% Vanguard Total Stock Index, 12.5% Vanguard Total International Stock Index and 50% Vanguard Total Bond Index
**consists of 26.25% Vanguard Total Stock Index, 8.75% Vanguard Total International Stock Index and 65% Vanguard Total Bond Index
***Vanguard Total Bond Index
****Vanguard S&P 500 Index Fund
*****consists of 45% Vanguard Total Stock Index, 15% Vanguard Total International Stock Index and 40% Vanguard Total Bond Index.
******consists of 75% Vanguard Total Stock Index and 25% Vanguard Total International Stock Index
Material Of A Less Serious Nature
A woman accompanied her husband to the doctor’s office. After his checkup, the doctor called the wife into his office alone.
He said, “Your husband is suffering from a very severe disease, combined with horrible stress. If you don’t do the following, your husband will surely die.”
“Each morning, fix him a healthy breakfast. Be pleasant, and make sure he is in a good mood. For lunch make him a nutritious meal he can take to work. And for dinner, prepare an especially nice meal for him. Don’t burden him with chores, as this could further his stress. Don’t discuss your problems with him; it will only make his stress worse.”
“Try to relax your husband in the evening by wearing lingerie and giving him plenty of backrubs.”
“Encourage him to watch some type of team sporting event on television. And most importantly, make love with your husband several times a week and satisfy his every whim.”
“If you can do this for the next 10 months to a year, I think your husband will regain his health.”
On the way home, the husband asked his wife, “What did the doctor say?”
“You’re going to die,” she replied.

Hopefully, there aren’t any big, hairy spiders in your life. But if there is, please don’t use your cellphone to kill them! Thanks for your continued trust and confidence in all of us at TABR. May the vaccines work and the virus be mostly eradicated. Best wishes to you for a great 2021.
Sincerely,

Bob Kargenian, CMT
President
TABR Capital Management, LLC (“TABR”) is an SEC registered investment advisor with its principal place of business in the state of California. TABR and its representatives are in compliance with the current notice filing and registration requirements imposed upon registered investment advisors by those states in which TABR maintains clients. TABR may only transact business in those states in which it is notice filed, or qualifies for an exemption or exclusion from notice filing requirements.
This newsletter is limited to the dissemination of general information pertaining to our investment advisory/management services. Any subsequent, direct communication by TABR with a prospective client shall be conducted by a representative that is either registered or qualifies for an exemption or exclusion from registration in the state where the prospective client resides. For information pertaining to the registration status of TABR, please contact TABR or refer to the Investment Advisor Disclosure web site (www.adviserinfo.sec.gov).
The TABR Model Portfolios are allocated in a range of investments according to TABR’s proprietary investment strategies. TABR’s proprietary investment strategies are allocated amongst individual stocks, bonds, mutual funds, ETFs and other instruments with a view towards income and/or capital appreciation depending on the specific allocation employed by each Model Portfolio. TABR tracks the performance of each Model Portfolio in an actual account that is charged TABR’s investment management fees in the exact manner as would an actual client account. Therefore the performance shown is net of TABR’s investment management fees, and also reflect the deduction of transaction and custodial charges, if any.
Comparison of the TABR Model Portfolios to the Vanguard Total Stock Index Fund, the Vanguard Total International Stock Fund and the Vanguard Total Bond Index Fund is for illustrative purposes only and the volatility of the indices used for comparison may be materially different from the volatility of the TABR Model Portfolios due to varying degrees of diversification and/or other factors.
Past performance of the TABR Model Portfolios may not be indicative of future results and the performance of a specific individual client account may vary substantially from the composite results above in part because client accounts may be allocated among several portfolios. Different types of investments involve varying degrees of risk, and there can be no assurance that any specific investment will be profitable.
The TABR Dividend Strategy presented herein represents back-tested performance results. TABR did not offer the Dividend Strategy as an investment strategy for actual client accounts until September/October 2014. Back-tested performance results are provided solely for informational purposes and are not to be considered investment advice. These figures are hypothetical, prepared with the benefit of hindsight, and have inherent limitations as to their use and relevance. For example, they ignore certain factors such as trade timing, security liquidity, and the fact that economic and market conditions in the future may differ significantly from those in the past. Back-tested performance results reflect prices that are fully adjusted for dividends and other such distributions. The strategy may involve above average portfolio turnover which could negatively impact upon the net after-tax gain experienced by an individual client. Past performance is no indication or guarantee of future results and there can be no assurance the strategy will achieve results similar to those depicted herein.
Inverse ETFs
An investment in an Inverse ETF involves risk, including loss of investment. Inverse ETFs or “short funds” track an index or benchmark and seek to deliver returns that are the opposite of the returns of the index or benchmark. If an index goes up, then the inverse ETF goes down, and vice versa. Inverse ETFs are a means to profit from and hedge exposure to a downward moving market.
Inverse ETF shareholders are subject to the risks stemming from an upward market, as inverse ETFs are designed to benefit from a downward market. Most inverse ETFs reset daily and are designed to achieve their stated objectives on a daily basis. The performance over longer periods of time, including weeks or months, can differ significantly from the underlying benchmark or index. Therefore, inverse ETFs may pose a risk of loss for buy-and-hold investors with intermediate or long-term horizons and significant losses are possible even if the long-term performance of an index or benchmark shows a loss or gain. Inverse ETFs may be less tax-efficient than traditional ETFs because daily resets can cause the inverse ETF to realize significant short-term capital gains that may not be offset by a loss.
For additional information about TABR, including fees and services, send for our disclosure statement as set forth on Form ADV from us using the contact information herein. Please read the disclosure statement carefully before you invest or send money.
A list of all recommendations made by TABR within the immediately preceding one year is available upon request at no charge. The sample client experiences described herein are included for illustrative purposes and there can be no assurance that TABR will be able to achieve similar results in comparable situations. No portion of this writing is to be interpreted as a testimonial or endorsement of TABR’s investment advisory services and it is not known whether the clients referenced approve of TABR or its services.