What The Heck Is Per Stirpes, Market Cycles, And Why The Tape Is More Important Than The Fed
From time to time, we try to touch on planning topics that are not as well known to many clients, yet can be quite helpful in individual cases. For instance, a few years ago we wrote about the little known tactic called a loan recast.
Virtually every homeowner has heard of refinancing their mortgage loan. A recast, though, is foreign to many, and has served a number of our clients well when the right circumstances exist, especially because a recast typically costs about $350, while a refinance can easily run $3000 or more, depending on the size of the loan.
Likewise, when it comes to naming beneficiaries on IRA accounts or other retirement plans, the default option for a primary or contingent beneficiary is what’s known as Per Capita. This designation indicates that the Grantor (say the IRA is for the wife of a couple) intends that NO ONE except the named beneficiary receive that share of the estate.
Many investors, though, are unaware there’s another option, and frankly, many financial institutions don’t emphasize this. It’s called Per Stirpes, and we’ll explain it with a recent real story below.
Look also for a brief update on where we are in the market cycle, both near term and longer term. In addition, we’ll touch on why the Tape is more important than the Fed, and a reminder on the folly of listening to market gurus. Summer’s here, and it’s a great time for reading.
Per Stirpes VS Per Capita
Let’s illustrate a typical per capita example. You, the Grantor, are not survived by your spouse, but you have two children, Amber and Brian, and each of them has a child (so you have two grandchildren). When you die, 50% of your account (or estate) will go to each child. This is typical, and is known as Per Capita.
But, let’s say that before you die, your son Brian passes away and you forget to update your beneficiary form (s) and/or your estate plan. Under Per Capita, since Brian has passed away, his share will go to his sister, Amber, meaning in effect 100% of the account (s) will go to her.
So, what if you didn’t want that to happen? What if you wanted Brian’s share to go to your grandchild? In that case, you would need to choose a Per Stirpes designation on the beneficiary form. The problem is, many of the forms don’t offer this option and one typically has to ask for it, or make a specific request in writing.
I’ve given “normal” examples of how this might play out above. But, here’s another example of how a Grantor may want to purposely choose Per Capita. Let’s say one has a grandchild that frankly has turned into a less than desirable member of the family. A Per Capita designation is one way to make sure your money doesn’t pass down the stripe.
A Recent Story
A few years ago, one of our clients referred his mother to us, and by default, his sister (one of three siblings), since the sister was going to be taking over the finances for mother, along with relocating their mother near their sister. A pretty common situation, as I’m sure many of you realize who have multiple siblings and an older parent or parents.
Given the age of mother (86 at the time) and the need for income to pay for monthly care expenses, we recommended a combination of our all-bond account (pretty low-risk over time) with an immediate annuity with a 10-year period certain guarantee. As would be common, she listed all four of her children on both the Fidelity IRA application and the annuity application as 25% equal beneficiaries.
This took place during the 3rd quarter of 2015. But, in April of 2018, barely after retiring from her job, the sister passed away suddenly. The sister had two sons, both around 30 years old. But, because mother had used the default option of per capita on the beneficiary designation forms, her daughter’s share of both the IRA and the annuity went to her three remaining children, with nothing going to the grandchildren.
We don’t think this was intentional, and we’ll never know, because just a few months later, mother’s health deteriorated and she passed away in August of 2018. In the aftermath, we also discovered that our clients’ sister (the daughter) had later on her own purchased a second annuity for their mother with the same company, without our knowledge and we think, without the knowledge of her siblings. Needless to say, that wasn’t a good idea. She died before her mother, so her share of the contracts went to her siblings rather than to her sons.
Now, her siblings can choose to collectively collaborate and gift an appropriate amount to their nephews to in effect “make them whole,” but our point is that legally, they don’t have to. The beneficiary form trumps everything.
I think the lesson here is, we never know what life is going to throw at us. Estate planning is more than a will or a trust, and what those documents cover. It’s important to know what they don’t cover as well, such as company retirement plans, IRA accounts, transfer on death accounts, and annuities, for example. So, if you have children, and they have a spouse and/or children, think about your wishes and intentions.
If after understanding the meaning of Per Stirpes and you now realize things need to be updated with us and your Fidelity accounts and/or with other institutions, please let us help you get things changed to reflect your intent. You’ll sleep better at night.
The Current Stock Market Cycle
At the beginning of each year, Ned Davis Research prepares a cycle composite chart for the S&P 500 using data which goes back to 1928. It places equal weight on the One-Year Seasonal Cycle, the Four-Year Presidential Cycle and the 10-Year Decennial Cycle.
For instance, the One-Year Cycle (at least since 1950) shows that almost the entire gain of the stock market has taken place between November and April. The Presidential Cycle has shown that the 2nd year of a President’s term has tended to be the weakest, while Pre-Election years have been the strongest. That has played out in 2018 and thus far in 2019. Finally, the Decennial Cycle depicts what the stock market has done during each year of the decade (1929, 1939, 1949, 1959 and so on).
Below is the projection for 2019, with the dotted line showing the actual outcome thus far. The chart is courtesy of Ned Davis Research, at www.ndr.com.
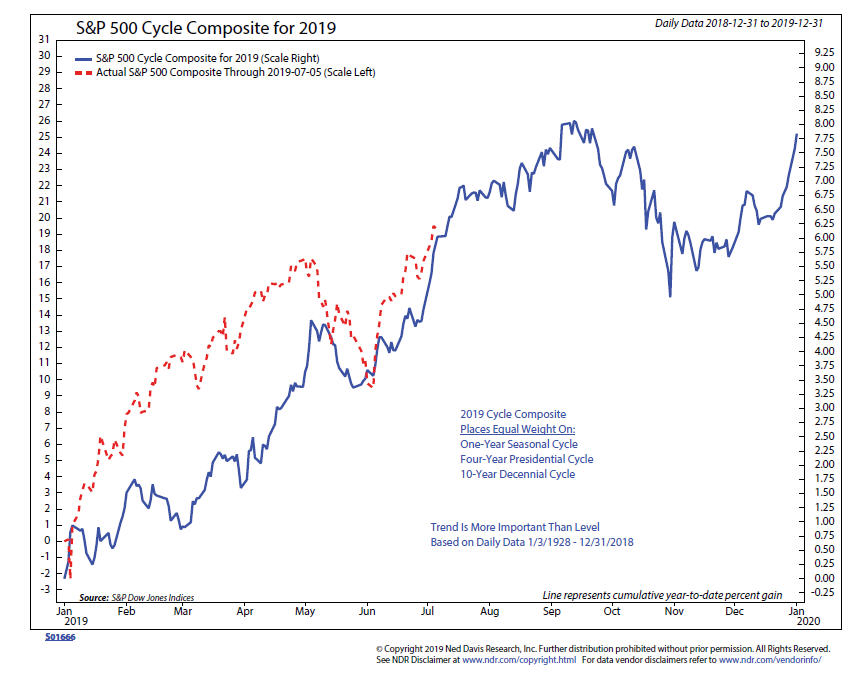
Cycles, or course, are inexact, but thus far, the composite has been mostly right on, calling for a retrenchment in May, followed by an upswing that tops out in early September, followed by a decline into November. Note that the projections are more about the direction of the stock market and not necessarily the magnitude of the move.
Like anything, cycles work until they don’t, and aren’t part of our formal discipline, but they can be helpful for context. What’s mostly useless, though, is putting credence in the prognostications of “experts.” Most of them are wrong, but hey, the financial media has to have somebody to quote.
One of the more colorful fund managers, and a pretty good one, actually, is Jeff Gundlach of the DoubleLine group of funds, which he founded. In mid-March, Gundlach was quoted as follows. “As for stocks, I think they’ll go negative on a year-to-date basis, probably sometime during the second quarter or early third quarter.” He added that “despite the recent jump in stocks—which came after the Federal Reserve made a ‘remarkable 180-degree turn’ on interest rates hikes in early January—the U.S. stock market “was and still is in a bear market.”
Granted, we still have 2 plus months to finish the 3rd quarter, but to go negative from here would require over a -20% decline. Anything can happen, but with the Fed easing and breadth confirming in a number of areas, this seems quite unlikely. Better to listen to what the market is saying rather than what people are saying.
For some well thought out views, though, I always read and absorb the writing and thinking of Howard Marks, Chairman of Oaktree Capital based in Los Angeles and author of Mastering the Market Cycle as well as The Most Important Thing.
When recently asked about where equities were in this cycle, he said “I think late stage. I still think that the probability of high returns is low and the probability of low returns is high. I don’t think we are setting the stage for some collapse, but I could be wrong.”
The Tape And The Fed
In the early 1980s, as I left my career in pro baseball and started in finance, I became fixated on the great Friday night show, Wall Street Week with Louis Rukeyser. One of the frequent guests on the show was Marty Zweig, whose newsletter I started subscribing to around 1979. Zweig was a blend of a technician and a quant, which really appealed to me, and was in the midst of carving out a great track record.
To my knowledge, Marty coined the phrases “Don’t Fight The Tape,” and “Don’t Fight The Fed,” which were the result of his excellent research. In English, his research showed that when stocks were acting well as measured by a variety of breadth, momentum and other internal indicators, it was best to be bullish and invested, and just the opposite when they weren’t. The other part of his work showed that the vast majority of the time when the Federal Reserve Board was creating loose monetary conditions (pumping the markets with liquidity), it was bullish for stocks, and quite the contrary when the Fed was tightening conditions.
Zweig died in 2013 at the early age of 70, and I can say that most of his work was based on market data from 1950 to the 1990s. I don’t have knowledge of how Zweig’s funds performed during the 2000-02 bear market or the 2007-09 collapse, but I think its noteworthy to understand that the two biggest stock market declines since 1972-74 took place during periods when the Fed was actually loosening monetary policy.
This is why in the majority of the stock market risk models we use to guide allocation decisions, we make sure that the Tape (market internals) is more important than the Fed. It is best when the Tape and the Fed are in sync together (both bullish), and it is worst when they are aligned negatively.
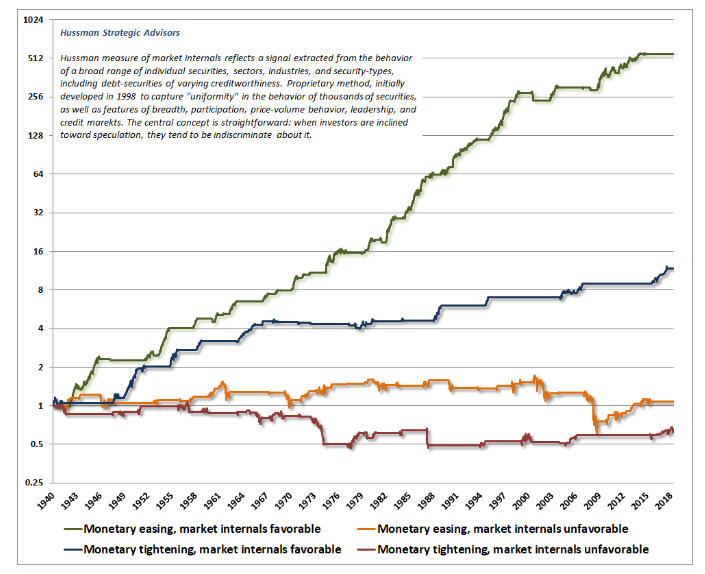
This is best illustrated by the chart above, courtesy of fund manager John Hussman, of Hussman Strategic Advisors. Hussman has his own proprietary methods of determining when the tape and monetary conditions are bullish and bearish, and in the chart, he shows hypothetically back to 1940 what has happened to stocks in the four possible combination of conditions. You can see his entire commentary at hussmanfunds.com.
Clearly, one wants to be invested when monetary conditions are loose (easing) and when market internals (the Tape) are favorable. But, one can still make money when monetary conditions are tight, as long as the Tape is favorable. When the Tape is negative, though, forget it. It doesn’t matter if there is monetary easing.
Which brings us to today. Where are we? In my opinion, this depends on your method, and its accuracy. Last year, the Fed was tightening, and then market internals began to turn unfavorable in October, and eventually, stocks fell hard. Then, the Tape turned in late December and the Fed turned more favorable in early January, and stocks have been rising since.
In our view, the Fed is easing and the Tape is mostly favorable, and as a result, our equity allocations have been at least 70-85% since mid-February and our high yield bond risk model has been favorable since mid-January. The S&P 500 and Dow Industrials made new all-time highs this past week confirmed by the advance/decline line and an expansion in stocks making new highs. There ARE divergences between the performance of large companies and small companies and the Transports which bear watching, but the overall supply and demand evidence is still that of a bull market until proven otherwise.
I can’t emphasize enough how important it is to know if your stuff works or not. Hussman clearly does not believe that market internals are favorable this year, as his Strategic Growth Fund is currently down -13.50% year-to-date in a market where the S&P 500 Index is up over 18%. We’ll have more on Hussman in a future update, because we have a long history with him which began around 2004 and ended around the middle of 2014.
TABR Scholarships and Cal State Fullerton
For close to 20 years now, I’ve provided annual scholarships to two students in the Finance Department at Cal State Fullerton as one way to give back to my school and others. I’m about to enter my 8th year as a Board Member for the equity team of Titan Capital Management, a class of senior Finance students who are learning how to analyze companies from mostly a fundamental perspective, write research reports and who are managing real money as part of the Cal State Fullerton endowment, thanks to the generous donations of colleague and alum Jeff Van Harte.

In a photo from our May awards and presentation day, I’m shown above with this year’s winners, Nolan Thompson (left) and Josiah Radford, both of whom were in the 2018-19 TCM class, each receiving $2,250. One of the other outcomes of this great student experience is that each year, the class donates a sum from the earnings of the portfolio to support the University’s Tutor center.
In the first year of the program, the class donated $5,000. As you can see from the photo below, with the entire class surrounding Emeline Yong, Associate Dean, the sum has grown to $30,000. It’s been quite rewarding to be part of this process, and I’m looking forward to the continued growth and success of the program.

Besides being heavily involved in the Titans’ baseball program, last year starting around March I’ve added the responsibility of being a member of the Finance and Investment committee which oversees the University’s $94 million endowment. It’s been interesting to sit on a different side of the table, being the client, and sharing my real world wisdom with the other committee members. All in all, just combining my love for baseball with finance.
TABR Marketing Efforts And Minimum Account Size
I just wanted to let you know that we are in the process of rolling out some new marketing work in an effort to grow our brand, and our business. When you see an email with a Visual Insights newsletter, that’s from us. It’s a different twist, and we’d appreciate any feedback, positive or negative. Please note this will be in addition to our regular updates and writings, which will not be going away!
Speaking of growth and our business, we currently serve about 230 households and are managing $143 million. They say if you’re not growing, you’re dying, and there’s an element of truth in that, but we’re not interested in becoming an enormous firm that loses touch with its clients.
However, the nature of decumulation in retirement means we have to grow a certain amount each year just to stay even. In that regard, our goal is to add from 6 to 10 quality new relationships per year, that of course are a good fit philosophically. For some 15 years, our minimum account size has been $300,000, but in analyzing our business, we’ve realized that our median account relationship is just over $600,000.
As a result, we’ve made a decision to increase our minimum account relationship going forward to the $500,000 level, to be closer in line with our median. No existing accounts will be affected by this, and we always retain the right to make exceptions for exceptional people who are referred to us.
Material Of A Less Serious Nature
An 80 year old man was having his annual checkup and the doctor asked him how he was feeling. “I’ve never been better!” he boasted. I’ve got an eighteen year old bride who’s pregnant and having my child! What do you think about that?”
The doctor considered this for a moment, then said, “Let me tell you a story. I knew a guy who was an avid hunter. He never missed a season. But one day he went out in a bit of a hurry and accidentally grabbed his umbrella instead of his gun.” The doctor continued, “So, he was in the woods and suddenly a grizzly bear appeared in front of him! He raised up his umbrella, pointed it at the bear and squeezed the handle. And, the bear dropped dead in front of him!”
“That’s impossible!” exclaimed the old man. “Someone else must have shot that bear.”
“That’s kind of what I’m getting at. . . .” replied the doctor.
Here’s to a great beginning of summer. Thanks always for your continued trust and confidence in all of us at TABR.
Sincerely,

Bob Kargenian, CMT
President
TABR Capital Management, LLC (“TABR”) is an SEC registered investment advisor with its principal place of business in the state of California. TABR and its representatives are in compliance with the current notice filing and registration requirements imposed upon registered investment advisors by those states in which TABR maintains clients. TABR may only transact business in those states in which it is notice filed, or qualifies for an exemption or exclusion from notice filing requirements.
This newsletter is limited to the dissemination of general information pertaining to our investment advisory/management services. Any subsequent, direct communication by TABR with a prospective client shall be conducted by a representative that is either registered or qualifies for an exemption or exclusion from registration in the state where the prospective client resides. For information pertaining to the registration status of TABR, please contact TABR or refer to the Investment Advisor Disclosure web site (www.adviserinfo.sec.gov).
The TABR Model Portfolios are allocated in a range of investments according to TABR’s proprietary investment strategies. TABR’s proprietary investment strategies are allocated amongst individual stocks, bonds, mutual funds, ETFs and other instruments with a view towards income and/or capital appreciation depending on the specific allocation employed by each Model Portfolio. TABR tracks the performance of each Model Portfolio in an actual account that is charged TABR’s investment management fees in the exact manner as would an actual client account. Therefore the performance shown is net of TABR’s investment management fees, and also reflect the deduction of transaction and custodial charges, if any.
Comparison of the TABR Model Portfolios to the Vanguard Total Stock Index Fund, the Vanguard Total International Stock Fund and the Vanguard Total Bond Index Fund is for illustrative purposes only and the volatility of the indices used for comparison may be materially different from the volatility of the TABR Model Portfolios due to varying degrees of diversification and/or other factors.
Past performance of the TABR Model Portfolios may not be indicative of future results and the performance of a specific individual client account may vary substantially from the composite results above in part because client accounts may be allocated among several portfolios. Different types of investments involve varying degrees of risk, and there can be no assurance that any specific investment will be profitable.
The TABR Dividend Strategy presented herein represents back-tested performance results. TABR did not offer the Dividend Strategy as an investment strategy for actual client accounts until September/October 2014. Back-tested performance results are provided solely for informational purposes and are not to be considered investment advice. These figures are hypothetical, prepared with the benefit of hindsight, and have inherent limitations as to their use and relevance. For example, they ignore certain factors such as trade timing, security liquidity, and the fact that economic and market conditions in the future may differ significantly from those in the past. Back-tested performance results reflect prices that are fully adjusted for dividends and other such distributions. The strategy may involve above average portfolio turnover which could negatively impact upon the net after-tax gain experienced by an individual client. Past performance is no indication or guarantee of future results and there can be no assurance the strategy will achieve results similar to those depicted herein.
Inverse ETFs
An investment in an Inverse ETF involves risk, including loss of investment. Inverse ETFs or “short funds” track an index or benchmark and seek to deliver returns that are the opposite of the returns of the index or benchmark. If an index goes up, then the inverse ETF goes down, and vice versa. Inverse ETFs are a means to profit from and hedge exposure to a downward moving market.
Inverse ETF shareholders are subject to the risks stemming from an upward market, as inverse ETFs are designed to benefit from a downward market. Most inverse ETFs reset daily and are designed to achieve their stated objectives on a daily basis. The performance over longer periods of time, including weeks or months, can differ significantly from the underlying benchmark or index. Therefore, inverse ETFs may pose a risk of loss for buy-and-hold investors with intermediate or long-term horizons and significant losses are possible even if the long-term performance of an index or benchmark shows a loss or gain. Inverse ETFs may be less tax-efficient than traditional ETFs because daily resets can cause the inverse ETF to realize significant short-term capital gains that may not be offset by a loss.
For additional information about TABR, including fees and services, send for our disclosure statement as set forth on Form ADV from us using the contact information herein. Please read the disclosure statement carefully before you invest or send money.
A list of all recommendations made by TABR within the immediately preceding one year is available upon request at no charge. The sample client experiences described herein are included for illustrative purposes and there can be no assurance that TABR will be able to achieve similar results in comparable situations. No portion of this writing is to be interpreted as a testimonial or endorsement of TABR’s investment advisory services and it is not known whether the clients referenced approve of TABR or its services.