What’s Your Bias? New Highs In Stocks, Or 7 Months (Or More) Of Going Nowhere
Isn’t it interesting, when news headlines get your attention, and shape your thinking? In this month’s update, both items in our headline are true. Last week, both the S&P 500 Index and Nasdaq 100 Index made new all-time highs, surpassing their September peaks.
On the other hand, mid-cap stocks, small stocks and foreign equities are all below their summer peaks from July and August and all three have made little or no progress from January 2018.
So, is the glass half-empty, or half-full? We’ll examine the “health” of the markets in this edition, along with an educational Medicare story you’ll not want to miss.
Finally, with markets recovering most of their 4th quarter losses, this is a good time to talk about the flexibility in our approach, as we’ve just lived through virtually mirror images of outcomes, with the first four months of 2019 almost the exact opposite of the last four months of 2018. Read on.
The “Health” Of The Markets
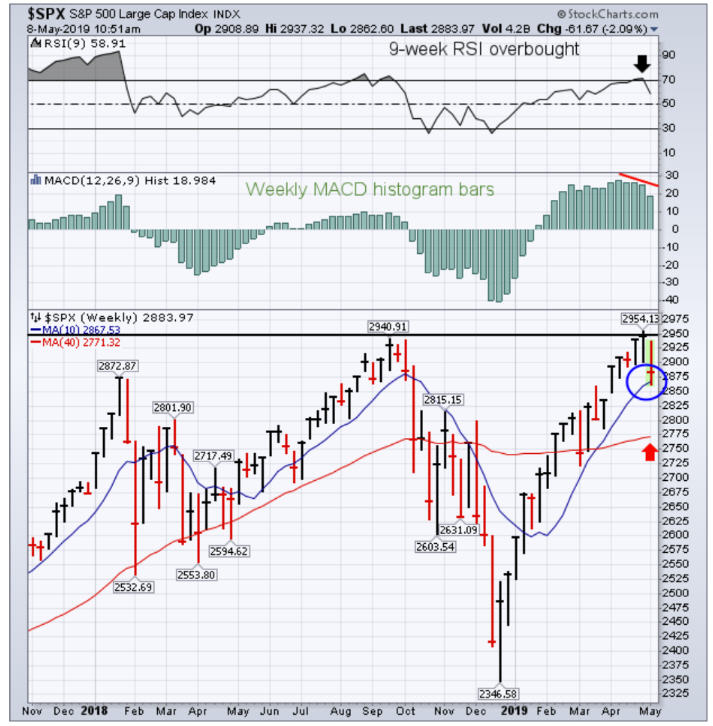
Last week, the S&P 500 Index exceeded its September 20 high by less than 1%, while the Nasdaq 100 (think technology), exceeded its October 1 high by 2.6%. See below the chart of the S&P 500, going back to November 2018, courtesy of www.stockcharts.com.
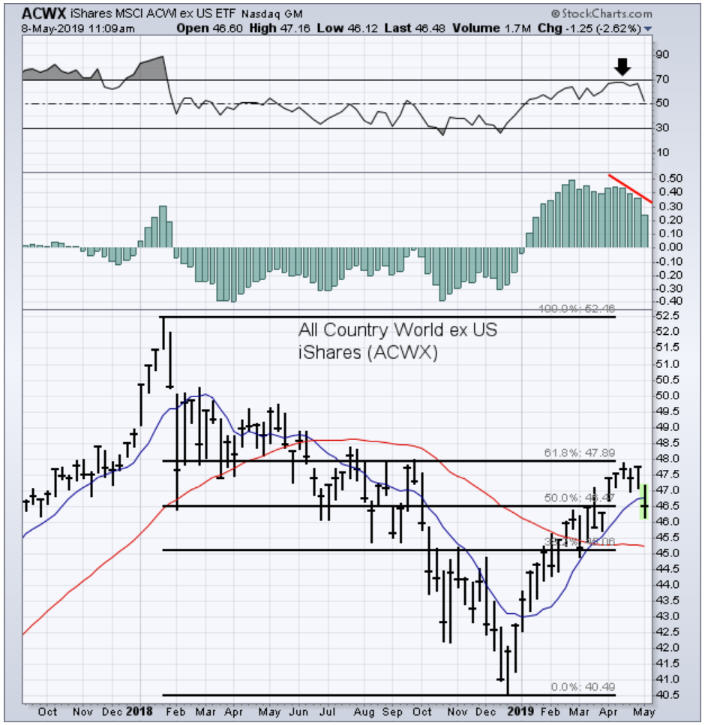
We’ve written in the past about the performance edge of the last several years of U.S. stocks in comparison to their foreign counterparts. This is evident in the chart below, which shows the MSCI All Country World Index Ex the US. Foreign stocks on average are greater than 11% BELOW their peaks from January 2018.
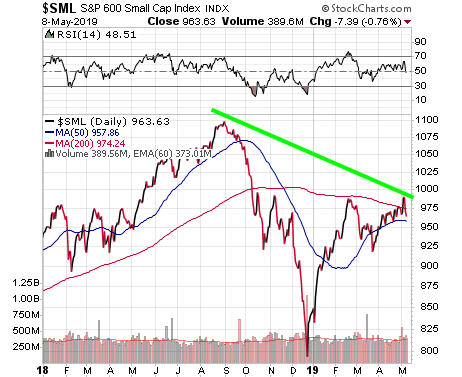
And, as the chart below shows of the S&P 600 Small Cap Index, small company stocks are lagging badly, very much like foreign shares.
In our view, this is indicative of late cycle behavior, as it is typical that small and mid-cap stocks peak before large company stocks, prior to the onset of a bear market. This glaring divergence could be cleared up in coming months, as it was with the rally off the early 2016 lows, but given that stocks have been mostly going up for 10 years, it’s important to know where you are in the cycle.
Above, you can see the differences by viewing the charts. Below, we present this evidence in table form, for those of you who are numbers oriented.
| 1-26-18 | Fall/Summer High | 5-3-19 | |
| S&P 500 Index | 2872 | 2930 | 2945 |
| Nasdaq 100 Index | 7022 | 7645 | 7845 |
| S&P Midcap | 1995 | 2051 | 1980 |
| S&P Smallcap | 979 | 1098 | 989 |
| EFA | 75 | 69 | 67 |
In the last few days, stocks have declined on negative tariff news, so as I write this, the S&P 500 is essentially trading where it was 15 months ago, not counting an approximate 2% dividend yield. Small, mid-cap and foreign stocks are below levels from January 2018, leaving only the NDX 100 with small gains.
So, is all of this negative? Not necessarily. The Chartist Mutual Fund Timer newsletter recently produced a table showing that over the past 60 years, the S&P 500 has set record highs 16 times after a span of at least 215 days between record highs. Over the following 12 months, the S&P 500 proceeded to gain an average of 16.6% including dividends. Only once was the index lower after 12 months.
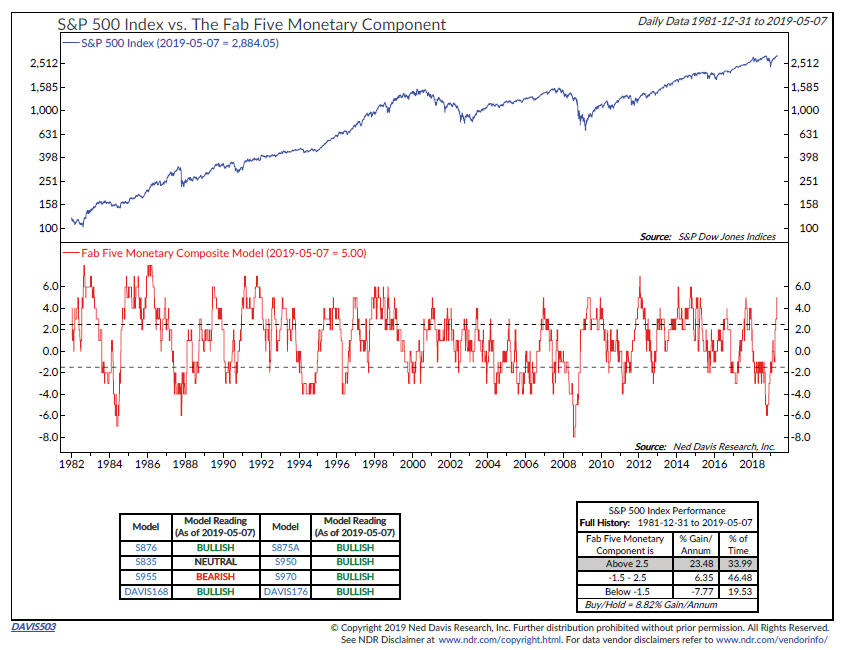
In addition, monetary conditions have returned to a bullish configuration, thanks to the reversal in Fed policy in early January. Since the beginning of the year, the yield on the 10-year Treasury Note has declined from 2.68% to 2.44%, and rates on 30-year and other fixed rate mortgages have dropped as well. Below is a plot of the Ned Davis Research Monetary Composite Model, courtesy of www.ndr.com.
This model consists of 8 different indicators which monitor the health of the bond market, and currently 6 of the indicators are in a bullish mode. Since 1981, in the 34% of the time this condition has existed, the S&P 500 Index has gained at a 23% annualized rate, which is more than double the norm. There’s a reason the late Marty Zweig used to say, “Don’t Fight The Fed.”
Over the near term, say the next 6 months or so, these are positive omens. Our own models remain mostly positive, with equity allocations at 85% invested and our corporate high yield bond model making new highs just last week. Over the longer term, though, the evidence continues to stack up as problematic.
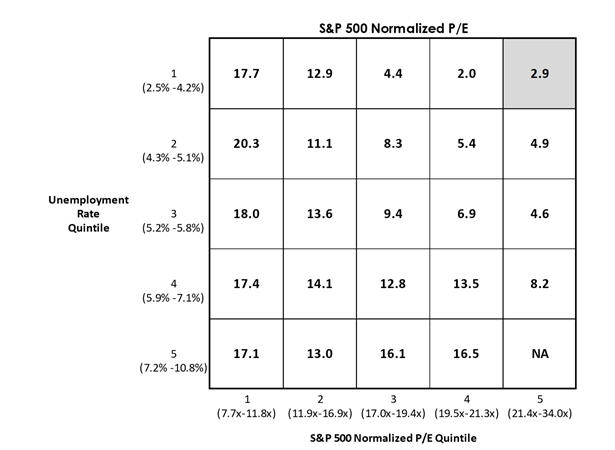
Our friend Doug Ramsey at the Leuthold Group recently produced a study which combined the unemployment rate with valuations. With permission, the table he created is produced below, and is based on data from 1948 to 2018.
When valuations reside in their top quintile (as they do now), and the unemployment rate resides in its lowest quintile (as it does now), forward seven-year annualized total returns for the S&P 500 have been a paltry 2.9%. Now you know what keeps us up at night, and some of the reasoning why Steve Medland and I are conservative when we are using projections with financial planning work. We’d like to be much more constructive, and no doubt at some point will be, but prices will have to decline a lot to make valuations more attractive. Note, though, that this doesn’t factor in to how our models work and how we make allocation decisions.
A Medicare Story To Pay Attention To
If you think navigating the tax code can be confusing, try understanding what to do, and importantly, what not to do, when it’s time to sign up for Medicare. Unfortunately, not all of the planning situations we come across have great outcomes, but in the hopes this one will help others in avoiding a similar fate, partner Steve Medland shares the following story:
We’d like to make you aware of a very expensive mistake that clients made when they turned 65 and enrolled in Medicare, in the hopes that this will help others avoid the same fate. We’re relaying this story with permission, and we’ve changed some of the details below to protect their anonymity. Our clients, whom we’ll call David and Melinda, are 67 and 65 respectively today. David retired five years ago at age 62, and he was covered by Melinda’s employer’s health insurance until she turned 65 in August 2018.
When David turned 65 in February of 2017, he was automatically signed up for Medicare Part A. However, when they asked Melinda’s HR department if he needed to sign up for Medicare Part B, the HR representative incorrectly told them that he didn’t need to sign for Part B until Melinda’s company health insurance ended when she would turn 65 and become eligible for Medicare. The reason given, which turned out to be true but irrelevant, was that Melinda’s health insurance premiums wouldn’t go down whether he signed up or not.
In fact, for those covered under a group health plan provided by an employer for which they or their spouse actively works, they have the right to delay enrollment in Medicare Part B until the employment or the coverage ends, whichever happens first. After the coverage ends, there is a Special Enrollment Period during which they can sign up for Medicare without risking late penalties.
When David turned 65 two years ago in February of 2017, he did not need to sign up for Medicare Part B since he was covered by Melinda’s health insurance. However, when Melinda retired in October of 2017, David was required to sign up for Medicare Part B or face late enrollment penalties. They still had health insurance through her previous employer until she would turn 65, but remember that those over 65 can only delay enrolment until the employment or the coverage ends, whichever comes first. Even though they were still covered by health insurance, David was required to enroll in Medicare Part B since Melinda’s employment ended. His Special Enrollment Period lasted for the eight months from October of 2017 until June of 2018. Melinda enrolled in Medicare Parts A and B when she turned 65 in August 2018, and at that point they realized that David had missed his window to enroll. That initially didn’t seem like a problem. Why not just enroll as soon as they discovered the error?
The reason is that you can only sign up for Medicare during certain times. For those turning 65, you can sign up during your Initial Enrollment Period (IEP), which lasts for seven months. The IEP begins three months before you turn 65, includes your birth month, and continues for the following three months. As stated above, a Special Enrollment Period (SEP) is available for eight months after retiring or employer coverage ends, whichever comes first. For those who miss the deadline for their IEP and SEP, they can only enroll in Medicare during what’s called a General Enrollment Period (GEP). This runs from Jan. 1 to March 31 each year, but coverage does not begin until July 1 of the same year.
In this case, even though our clients discovered the error last August, David couldn’t sign up for Medicare Part B until the General Enrollment Period began on January 1, 2019, and his coverage won’t begin until July 1, 2019. Since he was not covered by Medicare and their employer coverage ended when Melinda turned 65, he signed up for a private health insurance plan until his Medicare coverage begins. The cost of this plan is $1,100 per month. This means that they have been paying $1,100 per month from last August and will continue paying until July 1, for a total of about $12,000 of otherwise unnecessary health insurance premiums. In addition to the $12,000, David will pay a 10% penalty ($13.50 per month, which is 10% of the $135 monthly Medicare Part B premium) for the rest of his life.
Because of this and other Medicare enrollment errors that we’ve seen recently, last year we purchased Medicare enrollment software to better assist our clients with this issue. If you or your spouse are turning 65 in the next year, please reach out to us so we can help you with this very important decision.
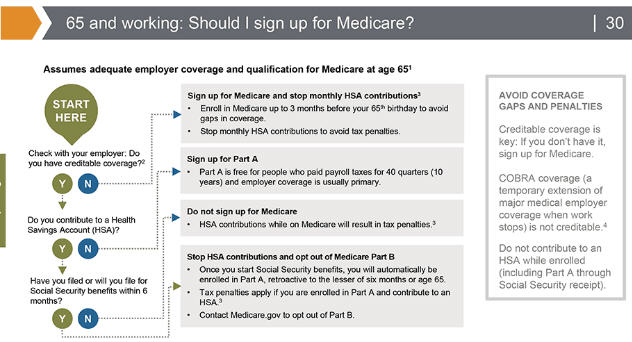
We also came across a helpful flow chart to follow, for those that are rapidly approaching age 65 and wondering, should I sign up for Medicare? The information is courtesy of J.P. Morgan Asset Management.
Tim Mead And Angels Baseball—Synonymous
In the summer of 1980, in my role as Assistant PR Director for the California Angels, I hired Tim Mead as an intern out of Cal Poly Pomona. In December of 1981, I left the Angels to pursue a career in finance, and Tim took my position. He’s been there ever since, for 40 years, in a variety of roles, but mostly as the link between the organization and the media, an immense role.
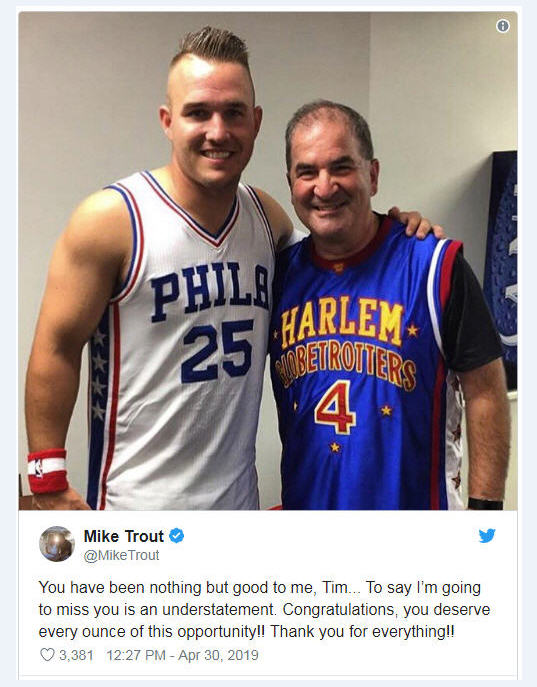
When I learned of his new position as President of the Baseball Hall of Fame (which he will begin this September), I thought—how could I describe Tim to someone who doesn’t know him? There are many superlatives, but this is the most succinct—the most trusted email in-box and cell phone number of anyone in all of professional baseball. That’s Tim. God could not have created a finer man, in his new role, to preserve and enhance the memories of perhaps the greatest sport ever. Bravo, Tim! Here’s Tim below with another great Angel, Mike Trout.
TABR’s Flexible, Tactical Approach
We’ll touch on this topic in more detail next month, as this update is running longer than I anticipated. Just know this. In December, our equity allocations went from 50% invested to about 13% in two weeks, remained near zero into early January, and was back to 85% by February 19.
There were significant losses for stocks in December, and significant gains in January and beyond. As we’ve mentioned to many clients and prospective clients, our process is designed to get you there, with a smoother ride. That’s exactly what it’s doing.
As noted above, our models are mostly positive, and that’s how we align things until they change. We certainly hope for higher prices, but don’t predict them. Considering all of the research we have shown above, my educated guess is that the upside from current levels is limited. Seasonality is now negative until late October, but that indicator has not been very effective in recent years, perhaps because of its widespread acknowledgement.
It’s really important in our opinion to have a process that can adapt to any environment, and that’s what we’ve attempted to do, and it is the process we favor.
Material Of A Less Serious Nature
Three dogs were sitting in the waiting room at the veterinarian when they struck up a conversation. The Yellow Lab turned to the Black Lab and said, “So, why are you here?”
The Black Lab replied, “I’m a pisser. I piss on everything. . . .the sofa, the curtains, the cat, the kids. The final straw was last night when I pissed in the middle of my owner’s bed. So, I’m here to get neutered. They reckon it’ll calm me down.”
The Yellow Lab replied, “Oh, yeah? Well, I’m a digger. I dig under fences, dig up flowers and trees, I dig just for the hell of it. When I’m inside, I dig up the carpets, but I went over the line last night when I dug a great big hole in my owner’s couch. So, like you, I’m here to get neutered.”
The Black Lab then turned to the Great Dane and asked, “Why are you here?”
“Well, I’m a humper,” said the Great Dane. “I’ll hump anything. I’ll hump the cat, a pillow, the table, fence posts, whatever. I’m not proud of it but I just hump everything I see. So yesterday, my owner was getting out of the shower and yada, yada, here I am.”
The two Labs exchanged a knowing glance and said, “So, it’s off with your nuts too, huh?” With a confused look, the Great Dane replied, “No, I’m just here to get my nails clipped.”
If you didn’t laugh at that, well, there’s something wrong with you! I definitely need some cheering up, as my Dallas Stars were eliminated from the Stanley Cup playoffs Tuesday night after a 4-hour, double overtime elimination game against St. Louis. Playoff hockey is pretty much the ultimate for me, especially when your team has only been there 3 times in 11 years. You really relish any success, and put your soul on the line with the team, in 95 games (in this case) over 8 months.
Overtime in the playoffs is another level. Unless you’ve been there, it is hard to explain. It is love and hate all at once, sometimes standing or on the edge of your seat for an hour or more. Because you know that in one instance, it will either be bliss or dejection. Hats off to my guys in Victory Green. It will not be easy to just move on to baseball. You see, my Angels, Giants and Fullerton Titans just aren’t very good (and that is a rarity for Fullerton). But, there is HOPE. The 49ers open camp in mid-July!
Thanks for your continued trust and confidence in all of us at TABR. And remember, HOPE is not an investment strategy.
Sincerely,
Bob Kargenian, CMT
President
TABR Capital Management, LLC (“TABR”) is an SEC registered investment advisor with its principal place of business in the state of California. TABR and its representatives are in compliance with the current notice filing and registration requirements imposed upon registered investment advisors by those states in which TABR maintains clients. TABR may only transact business in those states in which it is notice filed, or qualifies for an exemption or exclusion from notice filing requirements.
This newsletter is limited to the dissemination of general information pertaining to our investment advisory/management services. Any subsequent, direct communication by TABR with a prospective client shall be conducted by a representative that is either registered or qualifies for an exemption or exclusion from registration in the state where the prospective client resides. For information pertaining to the registration status of TABR, please contact TABR or refer to the Investment Advisor Disclosure web site (www.adviserinfo.sec.gov).
The TABR Model Portfolios are allocated in a range of investments according to TABR’s proprietary investment strategies. TABR’s proprietary investment strategies are allocated amongst individual stocks, bonds, mutual funds, ETFs and other instruments with a view towards income and/or capital appreciation depending on the specific allocation employed by each Model Portfolio. TABR tracks the performance of each Model Portfolio in an actual account that is charged TABR’s investment management fees in the exact manner as would an actual client account. Therefore the performance shown is net of TABR’s investment management fees, and also reflect the deduction of transaction and custodial charges, if any.
Comparison of the TABR Model Portfolios to the Vanguard Total Stock Index Fund, the Vanguard Total International Stock Fund and the Vanguard Total Bond Index Fund is for illustrative purposes only and the volatility of the indices used for comparison may be materially different from the volatility of the TABR Model Portfolios due to varying degrees of diversification and/or other factors.
Past performance of the TABR Model Portfolios may not be indicative of future results and the performance of a specific individual client account may vary substantially from the composite results above in part because client accounts may be allocated among several portfolios. Different types of investments involve varying degrees of risk, and there can be no assurance that any specific investment will be profitable.
The TABR Dividend Strategy presented herein represents back-tested performance results. TABR did not offer the Dividend Strategy as an investment strategy for actual client accounts until September/October 2014. Back-tested performance results are provided solely for informational purposes and are not to be considered investment advice. These figures are hypothetical, prepared with the benefit of hindsight, and have inherent limitations as to their use and relevance. For example, they ignore certain factors such as trade timing, security liquidity, and the fact that economic and market conditions in the future may differ significantly from those in the past. Back-tested performance results reflect prices that are fully adjusted for dividends and other such distributions. The strategy may involve above average portfolio turnover which could negatively impact upon the net after-tax gain experienced by an individual client. Past performance is no indication or guarantee of future results and there can be no assurance the strategy will achieve results similar to those depicted herein.
Inverse ETFs
An investment in an Inverse ETF involves risk, including loss of investment. Inverse ETFs or “short funds” track an index or benchmark and seek to deliver returns that are the opposite of the returns of the index or benchmark. If an index goes up, then the inverse ETF goes down, and vice versa. Inverse ETFs are a means to profit from and hedge exposure to a downward moving market.
Inverse ETF shareholders are subject to the risks stemming from an upward market, as inverse ETFs are designed to benefit from a downward market. Most inverse ETFs reset daily and are designed to achieve their stated objectives on a daily basis. The performance over longer periods of time, including weeks or months, can differ significantly from the underlying benchmark or index. Therefore, inverse ETFs may pose a risk of loss for buy-and-hold investors with intermediate or long-term horizons and significant losses are possible even if the long-term performance of an index or benchmark shows a loss or gain. Inverse ETFs may be less tax-efficient than traditional ETFs because daily resets can cause the inverse ETF to realize significant short-term capital gains that may not be offset by a loss.
For additional information about TABR, including fees and services, send for our disclosure statement as set forth on Form ADV from us using the contact information herein. Please read the disclosure statement carefully before you invest or send money.
A list of all recommendations made by TABR within the immediately preceding one year is available upon request at no charge. The sample client experiences described herein are included for illustrative purposes and there can be no assurance that TABR will be able to achieve similar results in comparable situations. No portion of this writing is to be interpreted as a testimonial or endorsement of TABR’s investment advisory services and it is not known whether the clients referenced approve of TABR or its services.

