When It’s Time To Buy, You Won’t Want To and Don’t Die, It’s Expensive, and Honoring Gerry Appel
I remember growing up in the 1960s and 70s watching television shows like Superman, I Love Lucy and Gilligan’s Island, and once in a while, in the middle of the episode, the TV would go “BEEP,” and then this alien voice would come on and say, “This is a test of the Emergency Broadcast System. In a REAL emergency, you would be asked to tune your television to Channel blah blah blah, and follow the instructions.”
With stocks falling nearly -13% in just seven trading days after an all-time high on February 19, one has to wonder—is this a REAL emergency? We’ll discuss what our technical work is suggesting, and what we’ve done, immediately below.
In addition, I’m going to give a primer on what to expect and what you need to know when someone close to you dies, and you happen to be the one responsible for taking care of the funeral. I have to tell you, it can be really stressful, even when you know what you’re doing. Unfortunately, I’ve had to attend four memorial services since December 20, including my 94-year-old aunt, a dear cousin’s mom, and that of a great mentor of mine, Gerry Appel of Great Neck, NY, who you’ll read about below. I’d say I have a bit more insight in this area, since my father, Harry Kargenian, was the best mortician in Tulare, CA, where I grew up until moving to Fullerton in 1977.
The Corona Virus Decline, What We’re Expecting, And How We’re Positioned
If you think markets trade on fundamentals in the short term, think again. They don’t. They trade on psychology, and thanks to perhaps the quickest decline in history for a correction (defined as a drop of more than -10% but less than -20%), we’ve gone from massive optimism to deep fear in just seven trading days. Last week, the Dow Industrials dropped -12.36%, the S&P 500 declined -11.50% and the NASDAQ fell -10.54%, the worst weekly percentage declines since October 2008.
For stocks, all of the gains since early October of last year were erased in a little over one week. The chart below, courtesy of www.stockcharts.com, shows the uptrend since December 2018, and the carnage of last week on the far right of the chart. For many, I’m sure it may have felt like the Tower of Terror at Disney World in Florida. Many of you may know the ride. Strapped in a seat, you slowly ascend to the top of the building, and then you are pushed out on a ledge, and then fall straight down, as your stomach lurches up through your throat (or something like that).
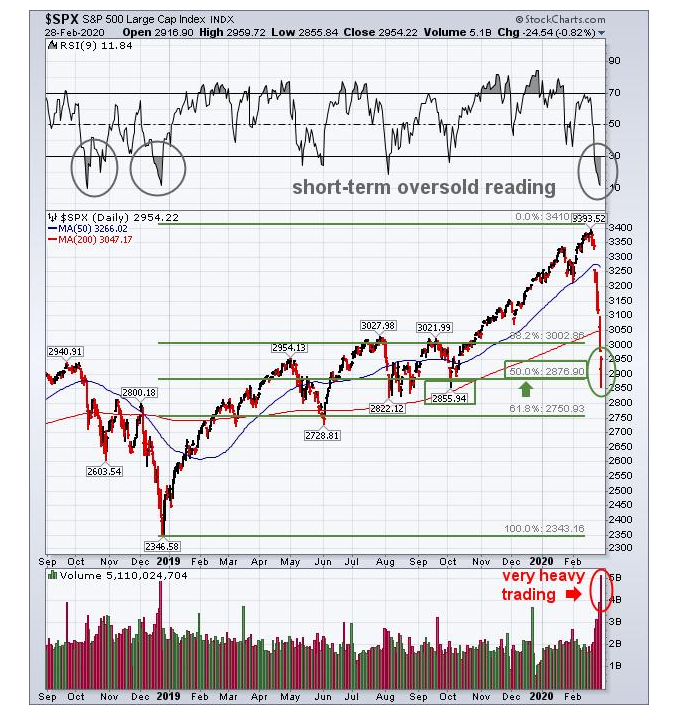
On Friday’s mid-morning decline to the 2850 zone of the S&P 500, that index fell to an approximate 50% retracement of the entire advance from December 2018 to the February 19 peak. For now, stocks seemed to have found some support near that level, rebounding nearly 100 points into the close on very heavy trading volume (see the bottom clip).
On daily charts, stocks are quite oversold and should bounce sometime this week. One indicator we’ve used since the late 1980s, called the McClellan Oscillator, is a measure of advancing and declining stocks. It reached the -408 level Friday, which has only been exceeded three times in the last 12 years (2008, 2010 and 2011). In each instance, stocks rallied nearly immediately, with the gains ranging from 3.6% in 2010 to 9% and 10% in the other instances. However, in all three cases, the rallies were met with selling which took stocks to new lows, with the most severe drop in October 2008 to November 2008.
As you can see from the chart above, the support levels below 2850 are from 2730 to 2750. If those levels were to give way, it’s conceivable a full retracement of the entire advance from December 2018 could take place, all the way back to the 2350 level. If that should occur, it would be a -30% decline from the peak, and a 38% retracement of the entire bull market which began in March 2009. An approximate 50% retracement of the bull market would take the S&P 500 to around 2028, which would be a -40% drop.
Another reason to expect a bounce, which could be as violent up as the move was down, is the VIX indicator, shown below, also courtesy of www.stockcharts.com. VIX is a measure of volatility, and spiked to over 49 intra-day Friday before closing just above 40.
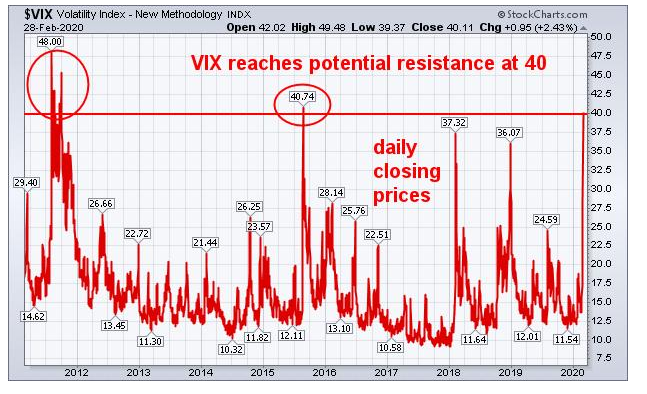
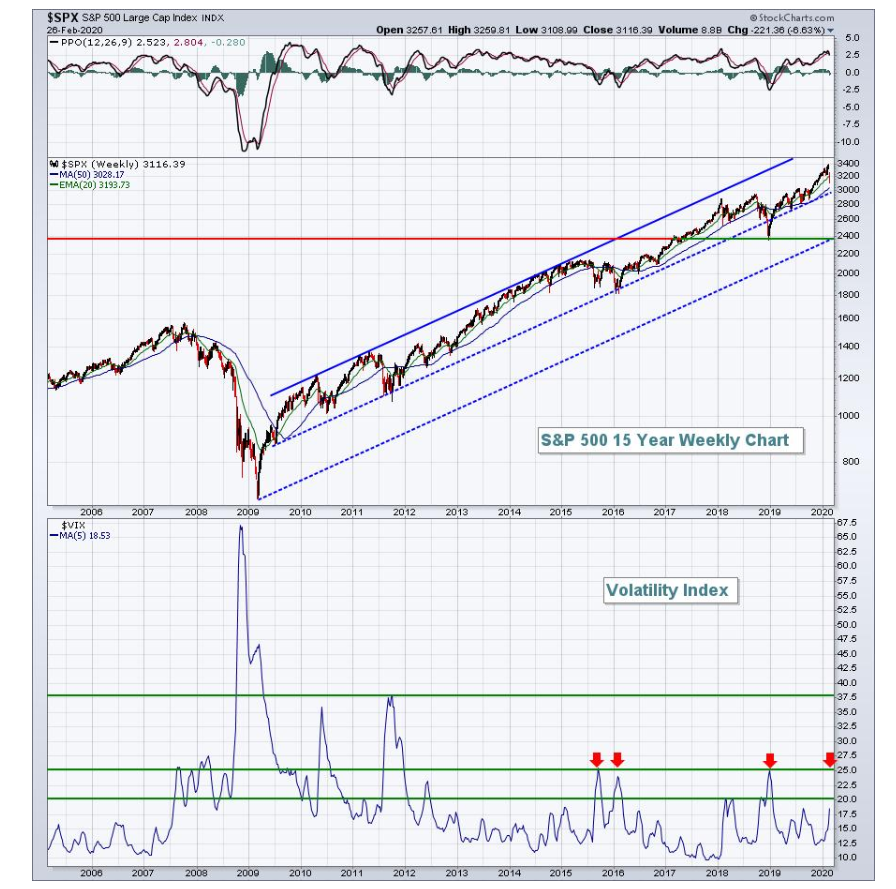
This was the highest close in this indicator since 2015, and virtually all extremes in this indicator have marked short-term bottoms in the past. The one problem with the chart above is that it only goes back to 2011. In a bear market, technical indicators behave differently, and during the 2008-09 bear market, this indicator went above 70. This is better illustrated in the longer term chart below. In the bottom clip, the VIX is shown with a 5-week SMA (simple moving average) and you can see the spike in 2008. On the upper chart of the S&P 500 going back 15 years, we violated the mid-channel line last week. That was at approximately the 3000 level. The lower channel line comes in at 2400. Could stocks fall that far? Absolutely, maybe even more. Anything can happen with the stock market, including a global recession caused by a virus that no one had ever heard of two months ago.
We’re not predicting that, as no one knows the future, but rather are laying out the risks as we see them from a technical analysis perspective. What we can tell you is what our models are saying and doing, and what we’ve done.
Portfolio Allocations
Along with updating everyone with the status of our models, this is a good opportunity to contrast passive management with active, tactical management, which is the vast majority of what we do at TABR.
We actually do run a passive, index-based portfolio using a mix of Vanguard funds, for those clients who wish to be more aggressive with a portion of their overall funds. They are comfortable with the strategy, and understand the risks. What is that strategy? Buy, and essentially, do nothing. We actually make one trade per year, on the first trading day of January, when we re-balance the mix back to the original target of 60% stocks and 40% bonds. That’s it. One simply has to have the discipline not to tinker with it. And, we don’t. It does great in up-trends, not so hot in downtrends.
We believe, though, that the vast majority of our clients prefer our risk management work, which is why we use tactical portfolios, and a variety of models. To be a passive, buy and hold investor, one has to be OK with losing 50-60% of your stock market allocation, and then hoping it comes back. We’re not comfortable with that, nor are the majority of our clients.
The vast majority of our risk management models use trend-following components. So, they typically will not buy bottoms or sell tops. With the stock market at all-time highs just 10 days ago, we’re not surprised that 6 of our 7 stock models were bullish entering last week, along with our high yield bond model, which had been in a Bullish mode since January 14, 2019. That’s changed considerably in the last 2 trading days. Our high yield bond model flashed a SELL and on Friday, we sold almost 90% of existing positions. Those funds will be going into short term bond funds. Unfortunately, with bond yields plunging on the quality side, short term yields are very different than in January of 2019. Also, in the last two days, two of our stock models went negative, so we’ve reduced positions in two of the three stock ETFs we own, some on Friday, and the rest today, Monday. At today’s close, our tactical equity exposure will be at about 55%, with 45% in cash.
One of the best analogies I can give to describe how we increase and decrease stock exposure is to compare it to driving a car in sunny weather, when all of a sudden, it starts to rain pretty heavily. You don’t stop, but you do tend to slow down. And then, if the rain turns into heavy thunderstorms with winds, you REALLY slow down. That’s how our stock models act. We’ve slowed down. Risk is very different right now than just two weeks ago. If the sun comes out soon, we may add some exposure, as one of our models can easily whip back and forth with the kind of volatility we are seeing. But, if we break below Friday’s lows in coming days or weeks, we expect at least 2 more models to turn negative, which would take our stock exposure down to about 25%. Ultimately, declines in the stock market of the -10% to -15% variety happen quite frequently, and risk management doesn’t typically add much alpha in those environments. It’s when the declines become -30%, -40% and -50% that risk management becomes really important.
Question—Is The Bull Market Over?
That’s a fair question, and candidly, we don’t have an answer. We’ll let the market tell us, by how it behaves in coming weeks. Since there has been a “buy the dip” mentality with this market for many years, keeping in mind the bull market has been going on for 10 plus years, I thought I’d use a quote as our headline, which has been attributed to long-time technical analyst Walter Deemer. He once said, “When it’s time to buy, you won’t want to.” Though stocks are oversold on daily charts, that is not the case on weekly charts, let alone monthly charts.
To give some balance to the question, I thought I would quote some out of this week’s commentary from Lowry Market Trend Analysis, a research publication we’ve been subscribing to for many years. Lowry’s takes a quantitative approach to market analysis, using data on market breadth and volume and taking some of their work back to as far as 1926. Here’s a snippet of what they wrote over this weekend.
“Persistent, weak Demand has finally taken its toll on the market. The result was a 7-day nearly 13% plunge in the S&P 500 from its Feb. 19 high. More significant, though, is the lack of evidence suggesting the Feb. 19 high in the S&P 500 represented a major market top and the end of the bull market. To the contrary, key measures of breadth, Supply and Demand all pointed to a healthy bull market. Over Lowry’s 95 year history of bull and bear markets, deteriorating breadth, in the form of weakening Adv-Dec lines, has provided consistent advance warning of an approaching major market top. Yet, at the time of the Feb. 19 high in the S&P 500, the NYSE all-issues Adv-Dec line was at a new all-time high. Other measures of breadth, such as New 52-week Highs and the % of NYSE issues trading above their 30-week moving averages, also provided little evidence of a major market top.”
I’ve written in the past that according to Lowry’s, there have been 19 major market peaks since 1926, and in 17 of those cases, there was advance warning from the Adv-Dec Line. It’s a limited sample. It also means that in 10% of the cases, there was no advance warning. In our view, given that things are happening that have never happened before, I would not be betting my money on one indicator, which is one of the reasons we use 7 different stock market models, not one.
So, pick your analyst. Lowry’s thinks the recent losses are only an interruption in an on-going bull market. They think higher price highs lie ahead. In contrast, fund manager John Hussman thinks this is the beginning of a decline that will take more than -60% off the value of the S&P 500 before it is over. Given his record of the last 11 years, Hussman at present has very little credibility. But, one never knows. A stopped clock is right twice per day. Using our analogy from above about driving a car, right now, we’ve put on the brakes and slowed down. In coming weeks, the market will tell us when it is OK to get back to the speed limit, or perhaps, come to a near complete stop.
Don’t Die, It’s Expensive
I’m sure that many of you reading this, like myself, have had to deal with losing a brother or sister, aunt or uncle, or mother or father, along with being responsible for planning and organizing all of the things associated with honoring a loved one. It can be quite a stressful situation, even when a death is expected. Unless you’ve been through it, though, you probably have no idea what’s involved. Growing up as the son of a mortician, I’m more familiar with funeral homes than most people. I even drove the flower car for my Dad when I was in high school to earn some extra money. I helped move caskets, and painted hallways of the mortuary he worked in for most of his career. But, nope, I never wanted to be a mortician. My father died back in March of 1995, ironically on my wedding anniversary. That was my Dad—what a sense of humor! You should probably credit him for me creating the Material of a Less Serious Nature segment below. More recently, though, my Mom passed away four years ago, and one of her sisters in mid-December, so all of the duties are quite fresh in my mind.
You may be surprised at how expensive it is today for a traditional burial with a casket, at a cemetery. Take a look. Below is the actual invoice for services for my Aunt, who passed away in Fresno in mid-December. This was from one of the best funeral homes in the Fresno area. Prices are likely to vary a bit by region of the country, but it will give you an idea of what all is involved. In this case, we pre-paid for the services back in 2017, actually selecting a casket at that time, so we wouldn’t have to deal with all of this at the time it happened. In this case, the casket was $2895, but I can tell, they range in price from about $700 for the cheapest, to some that are in excess of $8000.

Mind you, the $8243 you see wasn’t the total cost. We paid the pastor at my Aunt’s church in Fresno for officiating the service. We paid the singer and musician so that two songs could be performed. We made a donation to the church for the use of their building. The cost of the cemetery was over $2500, and that wasn’t counting the plot for my Aunt, which was purchased many years ago. The stone marker for her plot was another $800. Then, there was the obituary. I know we are in a digital world today, but I grew up with newspapers (and still read 4 of them daily and 5 on the weekend). I wrote an entire page to honor my Aunt, and submitted it to the Fresno Bee for publication with her photo. They wanted to charge me nearly $1400. I kid you not. They charge by the line. I had to delete two full paragraphs just to get the cost down to around $780.
Finally, there’s the meal. No matter the faith, it’s traditional that family honor their loved ones by breaking bread with friends and family. In my Aunt’s case, she was 94, so she’d honestly outlived most of her friends and family, and there were only about 25 people at the services, and only 16 at lunch. That lunch was still over $600 (hey, Armenian’s love to eat!). Just about one month ago, my cousin’s Mom passed away also in Fresno, and there were probably over 200 people at the lunch celebration, with a full bar and full buffet. It was fantastic and a wonderful memory. Point being, everyone has different tastes, and budgets.
Speaking of budgets, there’s been a marked change in the burial preferences of Americans in the last 50 years. As I was growing up, cremation was an after-thought in the 60s and 70s. But in a recent USA Today story, a report by insurance firm Choice Mutual found that 44% of Americans plan on being cremated, a 40% increase from the 1960s. Traditional burials were the second most popular choice at 35%.
On my Mom’s side of the family, she had two sisters and a brother, and only one sister is left, who we are helping more and more. She has already told me she wants to be cremated, just like her husband, my Uncle Charles. Care to guess how much it costs to be cremated? Well, again, costs may vary around the nation, but I went back to the funeral home in Fresno who just handled everything for my Aunt, and got exact quotes for cremation. You may be shocked. How about $1115 without a Memorial Service, and $1715 with a Memorial Service. Compare that to the $8243 number I showed above. No cemetery, no casket, no embalming. No frills, in other words. Some faiths (such as our Jewish friends) don’t permit the desecration of the body, but when you see the differences in costs, one can see why more people are choosing cremation over traditional burial. Plus, there isn’t any more real estate, and many cemeteries are running out of room.
I hope this is helpful to you, in navigating a difficult time and subject. For some levity on the subject, I harken back to one of the jokes my Dad used to tell. People would ask him, “How’s business, Harry?” He would reply, “Well, people are dying to see me!”
In Honor Of Gerry Appel
Most of you have likely never heard of Gerald Appel, but if you’re a client of ours, you’ve been benefiting from his influence on me since about 1985. I started subscribing to his newsletter, Systems and Forecasts, around 1983, and became friends over the phone with his subscription manager and later portfolio manager, Bonnie Gortler. That led to a professional relationship when I joined Prudential Securities, where I would go out and forge alliances with several different fund companies who would agree to take $millions of dollars of assets from Gerry’s company, Signalert Corporation, and allow them to trade their mutual funds using technical analysis signals. That went on from 1985 to 2003, shortly before I formed TABR with partner Steve Medland.
Gerry passed away on February 13 after deteriorating health and more severe dementia issues in the past year. With his son, Marvin, I got to see Gerry most recently about one year ago, but at that time, he no longer really knew who I was. That was OK. He’s been one of the most important people in my career and my life, teaching me much about technical analysis and timing models through his writing and research. Gerry was a professional money manager, directing the management of investor assets for more than 35 years. He authored, or co-authored more than 15 books, as well as numerous articles relating to investment strategies. He was a recognized expert in the field of technical analysis, having invented the MACD (moving average convergence-divergence) indicator in 1979, one of the most popular indicators in trading and a standard on all charting and software packages.
He founded Signalert Corporation in 1973, a registered investment advisory firm in Great Neck, NY, which is now run by his son, Marvin. The newsletter he founded, Systems and Forecasts, was highly rated from 1985 to 2000 by the Hulbert Financial Digest for its performance in market timing. Many of his articles were published in Money Magazine, Barron’s, Technical Analysis of Stocks & Commodities Magazine, Forbes, Kiplinger’s Magazine plus a feature in the New York Times. In its heyday, Gerry made an appearance on “Wall Street Week” with Louis Rukeyser.

Above is Gerry with me in our offices in Orange, CA, back in 2007 when Gerry and his wife Judy came out from NY to visit and be a part of my 50th birthday celebration. Of all the things Gerry gave to me, and they included love, friendship, wisdom, humor, great stories and knowledge about the markets, I’d say the best thing he did for me was teaching me how to fish. Meaning, he encouraged me to create my own business, and do my own thing, and not rely upon him. Much like a father or mother would do for their son or daughter. Teach them to be on their own. I’m so grateful for his teaching and encouragement, for over 30 years. Thank you, Gerry. I love you.
Material Of A Less Serious Nature
Women’s View: Computers should be characterized as male Because they have a lot of data but are still clueless. Because they are supposed to help you solve problems, but half the time, they ARE the problem. Because as soon as you commit to one you realize that if you had waited a little longer you could have had a better model. Because in order to get their attention you have to turn them on and Because big power surges knock them out for the rest of the night. COMPUTERS ARE MALE!
Men’s View: Computers should be characterized as female Because no one but the Creator understands their internal logic. Because the native language they use to communicate with other computers is incomprehensible to everyone else. Because the message “bad command or file name” is about as informative as “if you don’t know why I’m mad at you, then I’m certainly not going to tell you.” Because even your smallest mistakes are stored in memory for later retrieval. Because as soon as you make your commitment to one you find yourself spending half your paycheck on accessories for it. COMPUTERS ARE FEMALE!
Spring training is here, college baseball is in full swing, and the hockey playoffs are about five weeks out. Things can’t be all bad. As always, we appreciate the trust and confidence you place in all of us at TABR.
Sincerely,

Bob Kargenian, CMT
President
TABR Capital Management, LLC (“TABR”) is an SEC registered investment advisor with its principal place of business in the state of California. TABR and its representatives are in compliance with the current notice filing and registration requirements imposed upon registered investment advisors by those states in which TABR maintains clients. TABR may only transact business in those states in which it is notice filed, or qualifies for an exemption or exclusion from notice filing requirements.
This newsletter is limited to the dissemination of general information pertaining to our investment advisory/management services. Any subsequent, direct communication by TABR with a prospective client shall be conducted by a representative that is either registered or qualifies for an exemption or exclusion from registration in the state where the prospective client resides. For information pertaining to the registration status of TABR, please contact TABR or refer to the Investment Advisor Disclosure web site (www.adviserinfo.sec.gov).
The TABR Model Portfolios are allocated in a range of investments according to TABR’s proprietary investment strategies. TABR’s proprietary investment strategies are allocated amongst individual stocks, bonds, mutual funds, ETFs and other instruments with a view towards income and/or capital appreciation depending on the specific allocation employed by each Model Portfolio. TABR tracks the performance of each Model Portfolio in an actual account that is charged TABR’s investment management fees in the exact manner as would an actual client account. Therefore the performance shown is net of TABR’s investment management fees, and also reflect the deduction of transaction and custodial charges, if any.
Comparison of the TABR Model Portfolios to the Vanguard Total Stock Index Fund, the Vanguard Total International Stock Fund and the Vanguard Total Bond Index Fund is for illustrative purposes only and the volatility of the indices used for comparison may be materially different from the volatility of the TABR Model Portfolios due to varying degrees of diversification and/or other factors.
Past performance of the TABR Model Portfolios may not be indicative of future results and the performance of a specific individual client account may vary substantially from the composite results above in part because client accounts may be allocated among several portfolios. Different types of investments involve varying degrees of risk, and there can be no assurance that any specific investment will be profitable.
The TABR Dividend Strategy presented herein represents back-tested performance results. TABR did not offer the Dividend Strategy as an investment strategy for actual client accounts until September/October 2014. Back-tested performance results are provided solely for informational purposes and are not to be considered investment advice. These figures are hypothetical, prepared with the benefit of hindsight, and have inherent limitations as to their use and relevance. For example, they ignore certain factors such as trade timing, security liquidity, and the fact that economic and market conditions in the future may differ significantly from those in the past. Back-tested performance results reflect prices that are fully adjusted for dividends and other such distributions. The strategy may involve above average portfolio turnover which could negatively impact upon the net after-tax gain experienced by an individual client. Past performance is no indication or guarantee of future results and there can be no assurance the strategy will achieve results similar to those depicted herein.
Inverse ETFs
An investment in an Inverse ETF involves risk, including loss of investment. Inverse ETFs or “short funds” track an index or benchmark and seek to deliver returns that are the opposite of the returns of the index or benchmark. If an index goes up, then the inverse ETF goes down, and vice versa. Inverse ETFs are a means to profit from and hedge exposure to a downward moving market.
Inverse ETF shareholders are subject to the risks stemming from an upward market, as inverse ETFs are designed to benefit from a downward market. Most inverse ETFs reset daily and are designed to achieve their stated objectives on a daily basis. The performance over longer periods of time, including weeks or months, can differ significantly from the underlying benchmark or index. Therefore, inverse ETFs may pose a risk of loss for buy-and-hold investors with intermediate or long-term horizons and significant losses are possible even if the long-term performance of an index or benchmark shows a loss or gain. Inverse ETFs may be less tax-efficient than traditional ETFs because daily resets can cause the inverse ETF to realize significant short-term capital gains that may not be offset by a loss.
For additional information about TABR, including fees and services, send for our disclosure statement as set forth on Form ADV from us using the contact information herein. Please read the disclosure statement carefully before you invest or send money.
A list of all recommendations made by TABR within the immediately preceding one year is available upon request at no charge. The sample client experiences described herein are included for illustrative purposes and there can be no assurance that TABR will be able to achieve similar results in comparable situations. No portion of this writing is to be interpreted as a testimonial or endorsement of TABR’s investment advisory services and it is not known whether the clients referenced approve of TABR or its services.