It’s All About Supply And Demand, Not Necessarily Mean Reversion
At any given time, there can be considerable debate among financial strategists, money managers and commentators about whether stocks are cheap or expensive. Most of this is predicated on fundamental analysis, where one is looking at earnings, sales, dividends, cash flow and other fundamental metrics.
As you will see below, relative to the past, going back to 1926, the Shiller P/E ratio on the S&P 500, is at its third-highest level in history. This indicator is also known as the CAPE, or Cyclically-Adjusted Price Earnings, and was developed by Yale economics professor Robert Shiller.
Instead of looking only at 12-month trailing earnings, as the majority of Wall Street does, the CAPE normalizes earnings over the past 10 years, which is more reflective of the business cycle. The chart, created for us by PIMCO, was updated through December 2016 and showed the ratio above 28. With the S&P 500 Index gaining over 9% year-to-date, that ratio is now above 29, and has only been higher in 1929 and the period from 1998 to 2000.
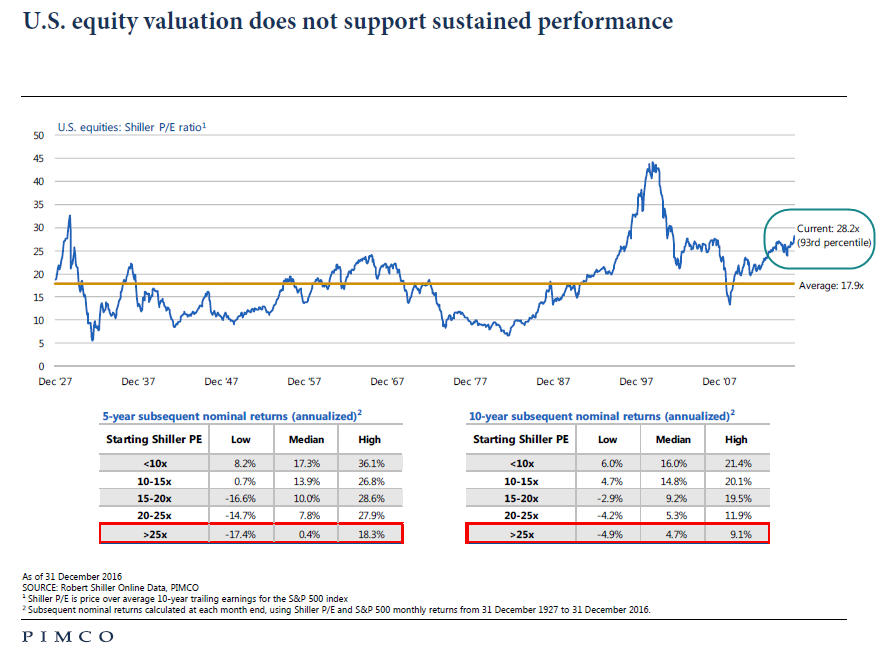
In both prior instances, stocks eventually declined over 50% from their peak, so the theory goes that is what is going to happen again once P/E ratios revert to their mean. In this case, the 91-year mean is just below the 18 level. But, does that have to happen? Since approximately 1990, the ratio has only been below the mean once, in the 2008-09 period when stocks collapsed.
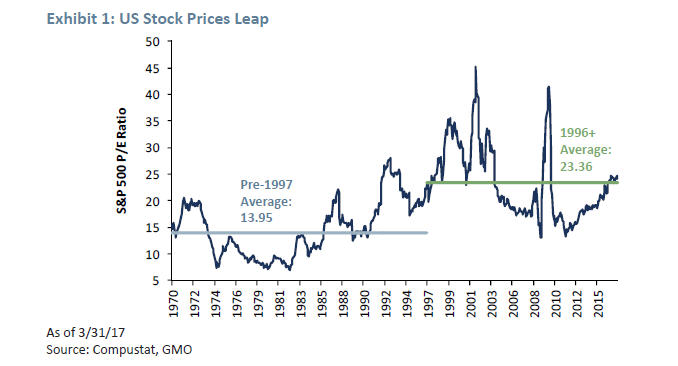
A noted value money manager, Jeremy Grantham of GMO, has recently postulated that though indeed P/E ratios may eventually mean revert, it could take a very long time. In other words, things are a bit different today than in the past. In investing, that line of thinking can be dangerous, but it appears to have some merit.
Below is a chart of the same Shiller P/E ratio, courtesy of Compustat and GMO, which shows the ratio only back to 1970. Importantly, they computed the mean prior to 1997 at 13.95, and from 1996 to the present at 23.36. What’s different about the last 20 years? Profit margins have been historically very high relative to history. If Grantham is correct and P/E ratios only revert back to the mean of the last 20 to 25 years, it would imply a more run-of-the-mill bear market in the range of -20% to -25%. But a decline to the 91-year mean implies a drop of between -40% and -50%, which I should note has happened twice in the past 17 years.
In the past four years (2013 to 2016), operating earnings on the S&P 500 have risen just 14% but prices as measured using the Vanguard S&P 500 Fund (VFINX) have gained 70%. That’s called P/E expansion. Investors should be reminded that there is such a thing as P/E contraction—it just hasn’t happened in quite some time. So, what’s driving prices higher?
Buybacks, Shrinkage and Lower Interest Rates
Three factors have been very large catalysts in driving stock prices higher the past 8 years. First, the Federal Reserve Board cut short term interest rates to zero, making stock yields more attractive than bond yields. This increased the demand for stocks. Second, according to an article in this week’s Barron’s, the number of stocks in the Wilshire 5000 Total Market Index has shriveled from 7,562 in 1998 to 3,599 today. That’s called shrinking supply. Finally, as the chart below shows, courtesy of Standard & Poors, the dollar volume of stock buybacks for S&P 500 companies has been huge by historical standards.
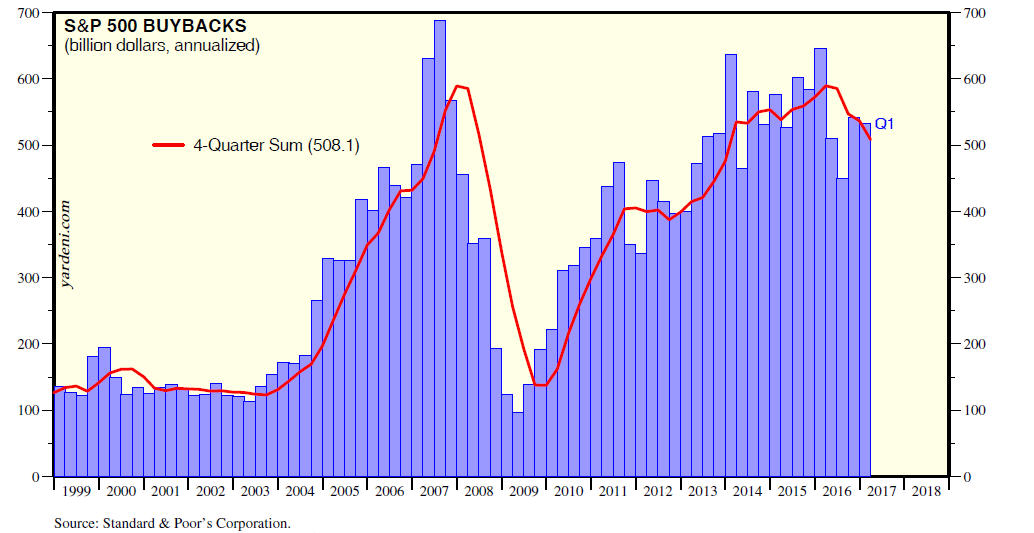
Don’t underestimate this phenomenon. It’s been a big prop for the stock market. All of this has resulted in demand being greater than supply. Fundamentally, though, how does one know how long this goes on? Anecdotally, the Fed is now in tightening mode, having increased short term interest rates four times since December 2015, with intentions to continue that trend for several years. That’s not likely to be helpful for stocks. As bond yields rise, there should be more demand for bonds and less demand for stocks. And, if corporate buybacks have peaked, that’s less demand as well. How does one sort all this out?
Don’t Worry, Use TA (Technical Analysis)
Ultimately, supply and demand drive stock prices, but fundamental indicators, in my view, are only helpful for determining risk. At the root of technical analysis is supply and demand, and that is why technical indicators can help navigate bull and bear markets, regardless of valuations.
For instance, as recently as 2012, Amazon (AMZN) earned all of 0.29 cents per share, and its stock was trading at 250, or 862 times earnings. It even lost money in 2014, yet today, the stock is above 960. Fundamental analysis would never have allowed one to buy this stock. Only technicals. Heck, Tesla (TSLA) debuted in 2010 around $20 per share and has yet to earn a profit, but the stock is $310 today. With fundamentals, you’d never buy the stock. There would be no justification (except perhaps hope). Only could technicals get you in.
So, what are the technicals saying now? Near term, there are some warning signs from the weekly chart of the S&P 500 below (chart courtesy of www.stockcharts.com), and the NASDAQ (not shown).
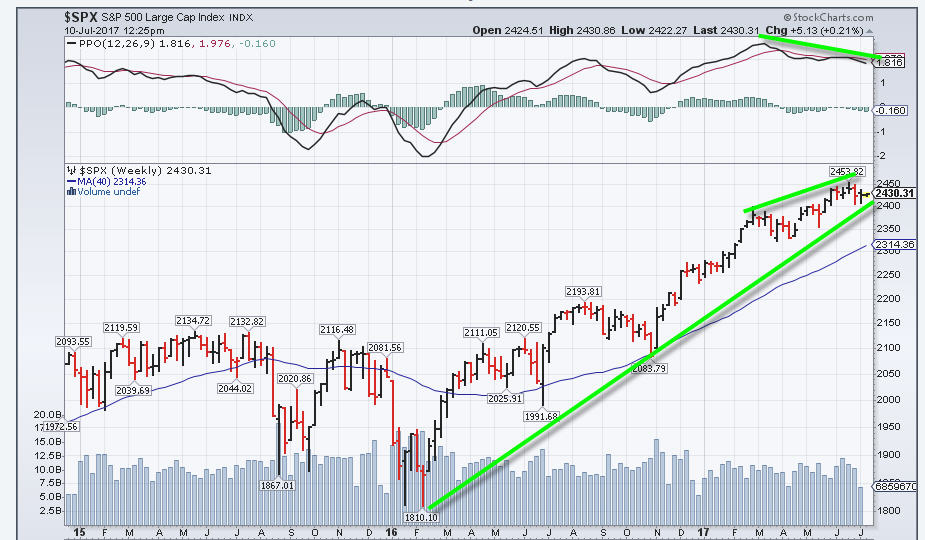
Momentum as measured by the PPO (Proportional Price Oscillator, top clip) has not confirmed recent highs, and in the last two days, the number of stocks reaching new 52-week lows on the NYSE have actually exceeded 52-week highs. This is a sign of increasing selectivity. In addition, technology stocks, which have been leading the market (Facebook, Apple, Netflix, Amazon and Google) peaked a few weeks ago and have been leading to the downside. The uptrend line from February 2016 is still intact, but with seasonal cycles negative through October, as I highlighted last month, the risk of a decline greater than a few percent appears greater than normal.
Longer term, though, leading indicators such as the NYSE daily advance/decline line remain positive and have been confirming new highs as recently as last week. History suggests, therefore, that the final price high is somewhere months into the future.
Update On The Fidelity TF/NTF Platform
Since we formed TABR in February 2004, we’ve been using Fidelity Institutional Brokerage Services as the sole custodian for our clients’ assets. They are the second largest independent custodian, behind Charles Schwab, with a large presence in the retirement plans market and terrific technology.
Like the other custodians, they have a large mutual fund and ETF platform. Mutual funds are broken down into two types—transaction fee (TF) and no-transaction fee (NTF). A quick primer on the difference. Transaction fee funds are typically advisor share class or institutional share classes which have lower internal fund expenses. These share classes are almost never burdened with what are known in the industry as 12 (b)-1 fees. This is an expense usually associated with retail share classes that help to pay distribution costs for the fund. The 12 (b)-1 fees are used to pay custodians like Fidelity and Schwab to make their funds available on the NTF platforms, and also to pay brokers (not to be confused with fiduciary RIAs) who sell the funds.
A typical 12 (b)-1 fee for a Class A share class has been 0.25%. Don’t believe anyone who tells you that you can buy and sell mutual funds at Schwab or Fidelity on an NTF platform and think that you aren’t paying fees. There is no free lunch here. Investors pay for this convenience in the way of higher fund expenses.
Also, I don’t know Schwab’s policy, but there is an additional thorn in the side at Fidelity when you purchase an NTF fund. If you hold the fund for less than 60 days, they impose a short term redemption fee which can be 0.5% of the value of the trade, with a minimum of $30 and a maximum of $200.
Let me give you an example of one of the funds we use in our bond allocation strategies. We currently invest in about 10 different corporate high yield bond funds. One of them is the Alliance Bernstein High Income Fund. We’ve used the Class A shares, AGDAX, for smaller accounts and it has an expense ratio of 0.85% annually. We’ve also used the Advisor share class for larger accounts, AGDYX, and it has a transaction fee, with internal expenses of 0.58%. Finally, there is the institutional share class, AGDIX, with an expense ratio of 0.53%. It also comes with a transaction fee.
You can see that the Advisor share class has lower expenses to the tune of 0.27% annually. Clearly, that is a better deal than the A shares, but one has to factor in how much you are paying in transaction fees. On average over a period of several years, our high yield bond risk model has generated just under two round trip signals per year (a round trip is a Buy and a Sell). Hypothetically, if each trade is $22, and one actually had two round trips a year, that would be $88 in fees. If one invests at least $35,000 in the fund, they would be saving $94 annually versus the Class A shares ($35,000 X 0.27%). So, it’s a better deal to buy the Advisor share class and pay the fees, UNLESS one trades more than two trips per year.
So, what’s new in this regard? Because of the pending Fiduciary rule from the Department of Labor (see TABR Monthly Update May 2016), Fidelity is trying to get ahead of the curve. There is tremendous focus on trying to eliminate the conflicts of interest in the industry where brokers get paid more to sell one fund over another. As a result, they are negotiating deals with a growing number of fund companies to move their advisor or institutional share classes to the NTF platform.
How they are doing this, I don’t know, because up to now, it has been common knowledge that a mutual fund firm must pay Fidelity or Schwab (and other custodians) 0.40% annually to be listed on the NTF platform. There has been very little, if any, payment on the TF side other than the transaction fee income which Fidelity keeps. As one can imagine, today when one can purchase dozens of ETFs (exchange traded funds) with expense ratios of 0.10% (or less), certain mutual fund share classes are not going to exist if a fund company has to pay Fidelity 0.40%.
In the above real example, the Alliance Bernstein High Income Advisor share class is now available NTF at Fidelity with an expense ratio at 0.58%. Purchases are subject to the short term redemption fee noted above, but in effect, this program should have the effect of eliminating Class A shares and other share classes which pay brokers a fee, because these fees will be mostly outlawed under the new Fiduciary standard.
This is a very positive step in the right direction. We will be using these share classes where available, but I should note we’ve already been using them since we mostly use TF funds in our bond strategies so that we are not subject to short term redemption fees. Not all of the fund families we use have signed up for this program, and that is OK, because their funds are still available on the TF platform that we have been using for 13 years. But, in a number of cases, such as with Prudential, or Principal, this move will typically save our clients a little more money than they’ve already been saving.
As for share classes, please don’t get me started. There are too many of them, and it’s confusing for investors and advisors. Some companies literally have 10 or more different share classes. And one wonders why some investors distrust the industry. Retirement funds should not be given special treatment, which is part of the problem. That is a bunch of crap. My IRA money (and yours) is no more important than my Trust money (or yours).
Someday, there may be a fiduciary standard that all advisors must comply with. And who knows, maybe there will only be two fund share classes instead of 10 or 15. But even if someday everyone is a fiduciary, it will not make everyone equal. There will always be differences in skill, wisdom, trust and integrity, no matter what the government mandates.
I’m just thankful for making a great decision many years ago to adopt the RIA model. We don’t have to go to our clients today and say, “Hey, Joe, just wanted you to know that effective January 1, 2018, I have to comply with a new law that says I’m to put your interests first.” No, we’ve been acting as a fiduciary since 1991.
By the way, just so you know how much things have changed in this area since I started in the industry in 1982, I began selling the American General Pace Fund with front-end commissions of 8.5% on a $25,000 purchase (I kid you not). That’s $2,125. Today, one could purchase 9000 shares of Apple at Fidelity, which is a trade valued at $1,305,000, for all of $4.95. This is just one area where technology has had a profound impact on lives (think IPhone too!).
Today’s Evidence And Current Investment Allocations
Nothing has changed since our June 1 update. Our stock market risk models are still 6 of 8 positive, which means stock market exposure is still at 75% of maximum. Our high yield bond model continues on its January 3 BUY, now over 6 months old. All in all, despite increasing warnings of a short term correction noted above, the longer-term uptrend remains intact, with higher prices likely several months out.
Given the indicator evidence, it is unlikely that we will see increased stock market exposure prior to late October, but we certainly can see a reduction should our models change. Right now, there is more demand than supply, but external factors such as sentiment and valuations remain mostly negative.
Material Of A Less Serious Nature
Father Norton woke up Sunday morning and realizing it was an exceptionally beautiful and sunny early spring day, decided he just had to play golf.
So. . .he told the Associate Pastor that he was feeling sick and persuaded him to say Mass for him that day. As soon as the Associate Pastor left the room, Father Norton headed out of town to a golf course about forty miles away.
This way he knew he wouldn’t accidentally meet anyone he knew from his parish. Setting up on the first tee, he was alone. After all, it was Sunday morning and everyone else was in church!
At about this time, Saint Peter leaned over to the Lord while looking down from the heavens and exclaimed, “You’re not going to let him get away with this, are you?”
The Lord sighed, and said, “No, I guess not.”
Just then, Father Norton hit the ball and it shot straight towards the pin, dropping just short of it, rolled up and fell into the hole.
IT WAS A 420 YARD HOLE IN ONE!
St. Peter was astonished. He looked at the Lord and asked, “Why did you let him do that?”
The Lord smiled and replied, “Who’s he going to tell?”
As I write this on Saturday night, it is ridiculously hot. Something like 95 today in Yorba Linda and Anaheim, and even higher like 105 or more in the Inland Empire (worse in Palm Springs and Phoenix!). Welcome to summer. Even so, Orange County has got to be one of the best places on Earth to live, as is the United States. I’m quite grateful for that, along with the trust and confidence that you continue to place in us daily.
Sincerely,

Bob Kargenian, CMT
President
TABR Capital Management, LLC (“TABR”) is an SEC registered investment advisor with its principal place of business in the state of California. TABR and its representatives are in compliance with the current notice filing and registration requirements imposed upon registered investment advisors by those states in which TABR maintains clients. TABR may only transact business in those states in which it is notice filed, or qualifies for an exemption or exclusion from notice filing requirements.
This newsletter is limited to the dissemination of general information pertaining to our investment advisory/management services. Any subsequent, direct communication by TABR with a prospective client shall be conducted by a representative that is either registered or qualifies for an exemption or exclusion from registration in the state where the prospective client resides. For information pertaining to the registration status of TABR, please contact TABR or refer to the Investment Advisor Disclosure web site (www.adviserinfo.sec.gov).
The TABR Model Portfolios are allocated in a range of investments according to TABR’s proprietary investment strategies. TABR’s proprietary investment strategies are allocated amongst individual stocks, bonds, mutual funds, ETFs and other instruments with a view towards income and/or capital appreciation depending on the specific allocation employed by each Model Portfolio. TABR tracks the performance of each Model Portfolio in an actual account that is charged TABR’s investment management fees in the exact manner as would an actual client account. Therefore the performance shown is net of TABR’s investment management fees, and also reflect the deduction of transaction and custodial charges, if any.
Comparison of the TABR Model Portfolios to the Vanguard Total Stock Index Fund, the Vanguard Total International Stock Fund and the Vanguard Total Bond Index Fund is for illustrative purposes only and the volatility of the indices used for comparison may be materially different from the volatility of the TABR Model Portfolios due to varying degrees of diversification and/or other factors.
Past performance of the TABR Model Portfolios may not be indicative of future results and the performance of a specific individual client account may vary substantially from the composite results above in part because client accounts may be allocated among several portfolios. Different types of investments involve varying degrees of risk, and there can be no assurance that any specific investment will be profitable.
The TABR Dividend Strategy presented herein represents back-tested performance results. TABR did not offer the Dividend Strategy as an investment strategy for actual client accounts until September/October 2014. Back-tested performance results are provided solely for informational purposes and are not to be considered investment advice. These figures are hypothetical, prepared with the benefit of hindsight, and have inherent limitations as to their use and relevance. For example, they ignore certain factors such as trade timing, security liquidity, and the fact that economic and market conditions in the future may differ significantly from those in the past. Back-tested performance results reflect prices that are fully adjusted for dividends and other such distributions. The strategy may involve above average portfolio turnover which could negatively impact upon the net after-tax gain experienced by an individual client. Past performance is no indication or guarantee of future results and there can be no assurance the strategy will achieve results similar to those depicted herein.
For additional information about TABR, including fees and services, send for our disclosure statement as set forth on Form ADV from us using the contact information herein. Please read the disclosure statement carefully before you invest or send money.
A list of all recommendations made by TABR within the immediately preceding one year is available upon request at no charge. The sample client experiences described herein are included for illustrative purposes and there can be no assurance that TABR will be able to achieve similar results in comparable situations. No portion of this writing is to be interpreted as a testimonial or endorsement of TABR’s investment advisory services and it is not known whether the clients referenced approve of TABR or its services.