Are California Taxes Really Higher than Most State Taxes? and The 2023 US Economic Outlook
A couple of months ago, one of our clients called me to ask about moving from California to Pennsylvania to accept a job promotion. We discussed several aspects of the move, including differences in the cost of living, housing prices, distance from friends and family, climate, local culture, and, very importantly, taxes. The tax question led me to do some compelling research that was relevant to our client, not to mention the other clients who have recently left California for other states and those considering a move.
California’s 13.3% marginal income tax bracket is the highest in the nation. However, the 13.3% bracket only applies to single filers earning more than $1 million annually and married filers earning more than $1,250,738. The highest tax bracket in the nation understandably leads most of us here to conclude we’re in a high-tax state.
However, our state income taxes range from 1% to 13.3%, based on the taxpayer’s income level. A California taxpayer making the median income would pay 4% in state income taxes, and some states have higher overall income taxes when considering all of their tax brackets.
For example, Oregon has a 9.9% top marginal income tax bracket but a lower income threshold for that rate. A single filer pays 9.9% above $125,000 of taxable income, and married taxpayers reach that level at $250,000 of income. Therefore, Oregon’s overall income taxes can be higher than California’s, depending on the taxpayer’s income level.
Another factor is that income taxes are only part of the equation. Most states charge a combination of three distinct types of taxes: income taxes, sales taxes, and property taxes. Total taxes will then depend on the taxpayer’s income, investments, what they buy, and the value of their property (home and vehicles).
Finally, some states tax Social Security, pensions, and other retirement income, while others don’t. More specifically, some states give retiree-friendly tax breaks, deductions, and exemptions that favor taxpayers over age 65. These same states may have a reputation as high-tax states due to heavy income taxes on affluent working-age individuals, but they may actually be low-tax states based on one’s individual circumstances.
There are an infinite number of variables based on everyone’s personal tax situation, the current state of residence, and the new state of residence. Since our client asked about a move from California to Pennsylvania, we’ll consider those two states as an example. Hopefully, the resources and tools in this discussion will be helpful to anyone considering a move to another state.
The personal finance website WalletHub published an interesting article in March 2022, analyzing the states with the highest and lowest taxes. The article ranked the states from 1 to 51, including the District of Columbia, where 1 (Alaska) has the lowest overall taxes, and 51 (Illinois) has the highest. I was surprised to see California as #11 on the list, the 11th lowest overall taxed state out of 51. Pennsylvania was #48 on the list, one of the highest-taxed states overall.
The finance magazine Kiplinger backs up these findings, listing California as the 9th “Most Tax-Friendly State for Middle-Class Families” and calling Pennsylvania a “Not Tax-friendly” state for both middle-class families and retirees. The article notes Pennsylvania’s low 3.07% flat state income tax rate but adds that most cities, towns, and school districts there add their own local income taxes. The Kiplinger analysis for other state taxes can be found at this link.
There are clearly some limitations to the above analysis. The calculations are focused on taxes for median-income households, and most of our clients earn well above the median income. The other huge caveat is the timing of the move, as some states give the tax breaks and exemptions mentioned previously that favor retired taxpayers.
Hawaii, occupying the #24 spot in the WalletHub rankings, is a great example. Based on the #24 position, it’s almost exactly in the middle of the pack for overall taxation. However, Hawaii gives taxpayers aged 65 and above an additional exemption of $1,144 per person. Hawaii also does not tax Social Security income or pension income (that doesn’t derive from contributions to the retirement plan). Someone with a large military or other public pension may be better off retiring in Hawaii than in a state like California, where all pension income is fully taxed.
The finance website Kitces.com ran an exhaustive study on the most tax-friendly states for retirees a few months ago. It included a handy spreadsheet that shows the deductions, exemptions, and taxation of investment income, social security, and pensions for all 50 states plus the District of Columbia. A screenshot showing the first half of the chart is below, and you can view the entire spreadsheet by clicking here.
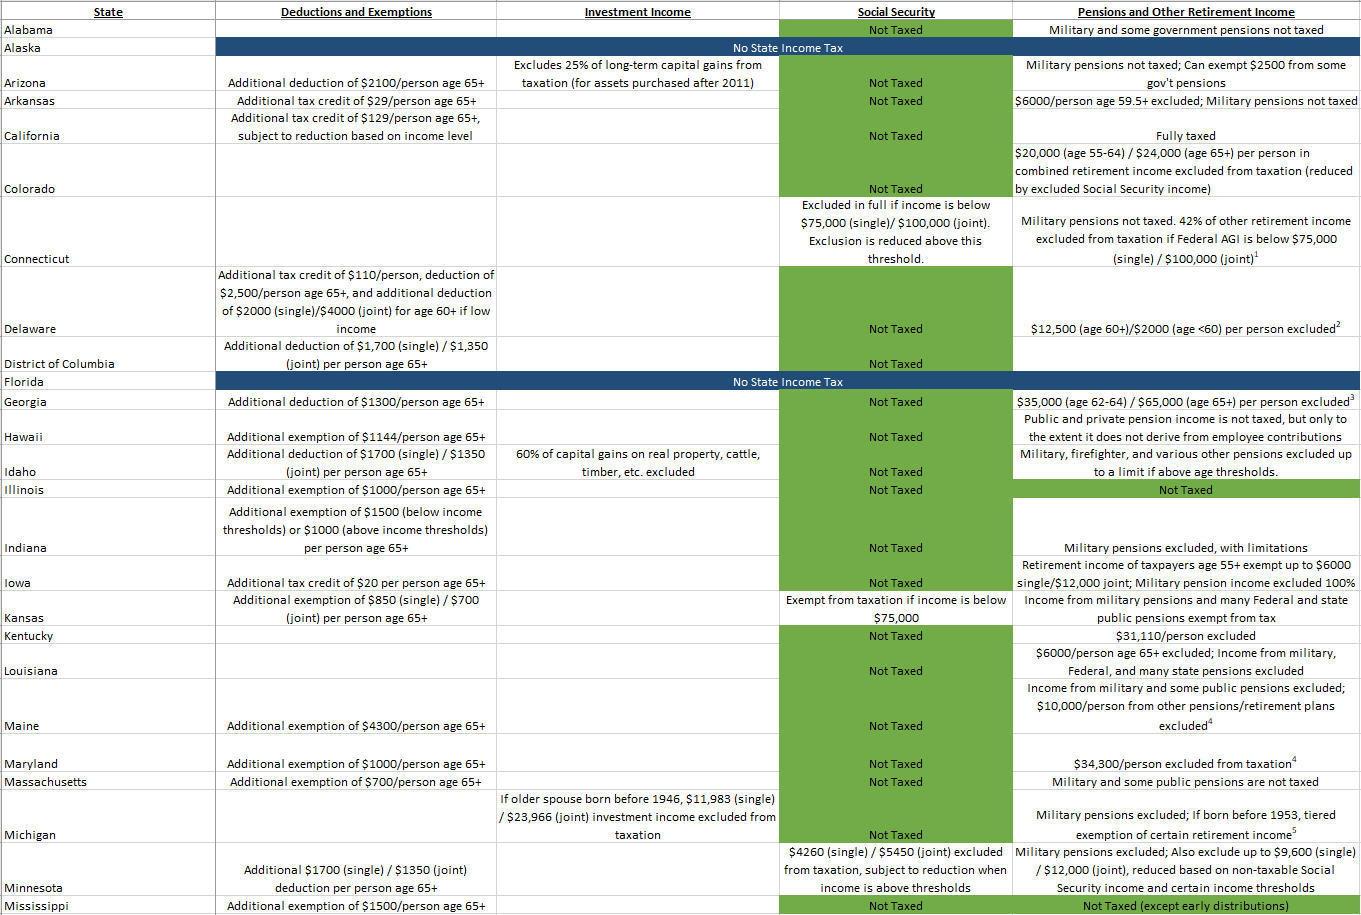
While I hope this discussion has been thought-provoking, the bottom line is that everyone’s situation is different, and what may be a high-tax state for one taxpayer may be a low-tax state for you, depending on the level and composition of your income and assets. The key is understanding your tax situation and the tax laws in various states to make an informed decision before a move.
The 2023 US Economic Outlook
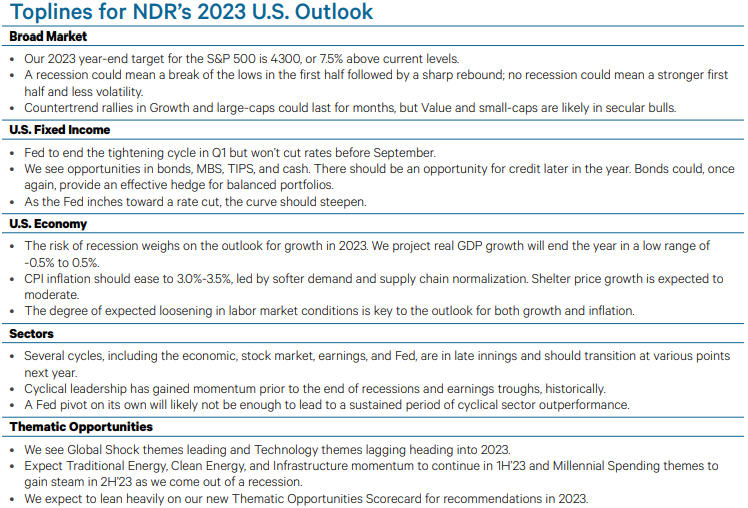
In last month’s newsletter, Bob Kargenian wrote about the inverted yield curve and how that likely portends a recession in the next 18 months. While Bob and I have always conveyed that we don’t manage money based on predictions, relying on our objective investment models instead, we do follow quite a few sources for current investment and economic research and analysis. One of our favorite providers of independent investment analysis is Ned Davis Research (NDR), which came out with its 2023 US Outlook earlier this month on December 6.
The table below, which you can click to enlarge, summarizes the report’s findings. The first thing that stands out, especially because clients often ask about the stock market, is that their 2023 year-end target for the S&P 500 is 4300. That’s about 11% above current levels, but stocks rarely move up in a straight line.
The report gives a 75% probability of a recession in 2023, most likely occurring in the first half of the year. If a recession does occur, it’s likely that stocks will drop below the 3577 low that was reached on October 12, 2022. That could mean a drop of 8% from current levels before stocks begin the predicted “sharp rebound.” Whether we enter into a recession or avoid one altogether, we will continue to follow the discipline imposed by our investment models, making adjustments to our stock allocation percentages as new information unfolds.
The Federal Reserve has been raising interest rates all year to combat inflation, but they’re walking a tightrope since higher interest rates can lead to more unemployment and lower stock prices. The current fed funds rate is 4.25%-4.5%, and the NDR analysts predicted the Fed will stop raising interest rates in the first quarter and won’t cut rates before September.
This is a great example of how quickly things can change. One week after NDR released its outlook report, Fed Chairman Jerome Powell said, “We still have some ways to go. As shown in the summary of economic projections, the median projection for the appropriate level of the federal funds rate is 5.1% at the end of next year — a half percentage point higher than projected in September.” The Fed may, therefore, not reduce interest rates in 2023 after all, although fed funds rate futures currently show that as a possibility.
Higher rates for longer aren’t usually good news for stocks, but it is great news for investing in money market, CDs, and T-Bills. The 1 Year Treasury Yield has gone from 0.40% at the beginning of 2022 to a whopping 4.64% today and is likely to remain at elevated levels until the Fed begins reducing rates.
The NDR report also predicts inflation to drop from the current level of around 8% to a much lower 3.0%-3.5% next year, mainly due to lower consumer demand and improvements in the supply chain as the world recovers from Covid disruptions. We’ll have more on inflation in the “Double-Digit Inflation in Almost Half the World” section below.
© Copyright 2022 Ned Davis Research, Inc. Further distribution prohibited without prior permission. All Rights Reserved.
How Does the Social Security Cost of Living Adjustment (COLA) Affect You?
In our October 2022 newsletter, Bob Kargenian wrote that the Social Security Cost of Living Adjustment (COLA) will increase benefits by 8.7% in January 2023. This year we’ve been asked the same question by a number of clients who are between the ages of 62 and 69 and have not begun taking Social Security yet: “Should I begin taking Social Security to lock in the 8.7% increase?”
The short answer is no; there’s no need to begin taking Social Security to lock in the increase. The COLA will be applied to the benefits of those not yet receiving Social Security as well as to those already receiving benefits.
The longer answer is the decision to start receiving Social Security benefits depends on a variety of factors, including your financial situation, life expectancy, and plans in retirement. The earliest age someone can be eligible to begin receiving Social Security is age 62, but doing so will result in a permanent 30% reduction in your benefit. You can receive your “full” Social Security benefit at your Full Retirement Age (FRA), which ranges from age 66 to 67, depending on your year of birth.
Those who want to get an even higher benefit can delay up until age 70. Anyone beginning to receive benefits after their FRA will have benefits increased by about 8% per year, up to a maximum of an approximate 32% increase at age 70. There is no additional increase in benefits by delaying past age 70.
When deciding whether to begin taking Social Security benefits before or after your FRA, consider the following factors:
- Your financial situation in retirement: Those with significant investment assets are more likely to be able to afford a delay in benefits because they can sell those assets to meet basic expenses, giving them the option to delay.
- Your life expectancy: Those expecting to have a longer than average life based on health and their parents’ longevity may benefit by delaying the start of benefits to receive that higher benefit for a longer time period.
- Your plans in retirement: Those planning to do consulting work or work part-time in retirement may be in a better position to delay the start of benefits, but those planning to retire without other sources of income may decide to start receiving benefits sooner.
Ultimately, the decision to begin receiving Social Security benefits is a complicated one, but we have helpful software and are here to answer any questions you may have regarding your own personal financial situation.
Current Portfolio Allocations
Since our last update in late November, our tactical equity exposure has shifted slightly to the negative side, with one of our stock market risk models generating a SELL on December 19. At present, only one of our five stock market models is positive, indicative of the ongoing bear market. This translates to about 40% tactical equity exposure. Depending on the rest of this week, it’s possible we could be in a maximum defensive position by next Tuesday’s close. Our high yield bond risk model remains on its October 31 BUY signal, nearly two months old now. That signal could be in jeopardy this week as well, depending on how credit markets behave. The yield on the 10-year Treasury Note peaked at 4.23% on October 24 and proceeded to drop to 3.40% on December 7. It’s now rebounded to 3.86%, and during this time, it’s no coincidence that equities have struggled the past two weeks during this rise. As we’ve noted in the past, almost all major declines in the stock market have taken place AFTER our high yield bond risk model has turned negative. All in all, our tactical portfolios are in a fairly defensive stance as we approach the New Year, and that could change to Max Protect in short order. The market will tell us.
Double-Digit Inflation in Almost Half the World
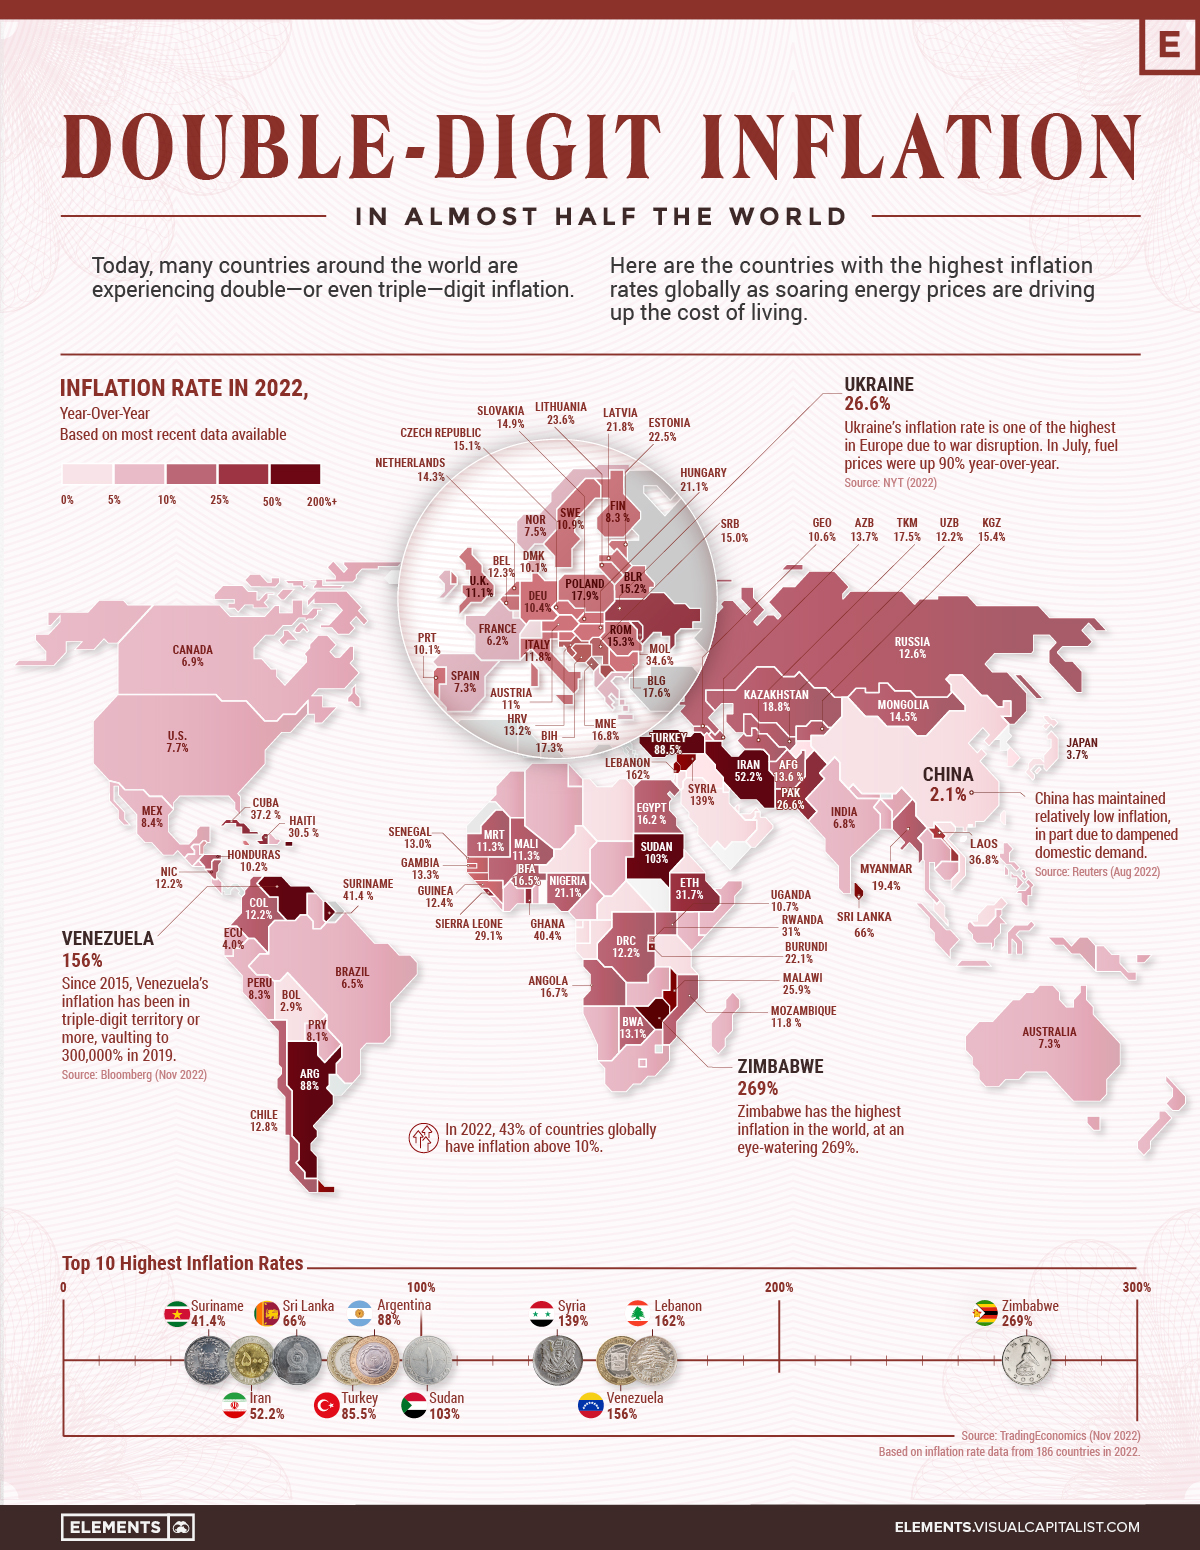
The 8.7% Social Security increase should be a nice benefit for many clients, given the inflation we’ve experienced in the US. Many Americans may not realize that as challenging as our inflation rate is, the US is suffering less than most of the world. The chart below, courtesy of Visual Capitalist, shows that almost half of the countries in the world are experiencing inflation rates above 10% (you can click on the map for an enlarged view).
This inflation has been triggered by geopolitical tensions leading to higher energy prices, combined with supply chain disruptions that have resulted in higher-priced goods.
The US inflation rate shown on the map is 7.7% as opposed to the 8.7% Social Security COLA because a different methodology was used, but the numbers are similar. Unfortunately, some countries like Venezuela, Sudan, Lebanon, and Zimbabwe are facing triple-digit inflation.
The last time the world saw such high inflation numbers was in the 1980s, and it took several years for inflation to recede. Let’s hope that Ned Davis Research’s outlook showing United States’ CPI inflation dropping to 3.0%-3.5% in 2023 is accurate!
 Spiraling Up Is Now Available in Audiobook Format
When I announced the publication of my book Spiraling Up: Discover Financial Serenity, Make Work Optional, and Live Happily in Retirement earlier this year, I got quite a few questions about an audiobook version.
Believe it or not, audiobooks surpassed ebooks’ sales figures three years ago and continue to grow at a double-digit pace annually, currently representing about 20% of the total book market.
With help from a professional narrator and my publisher, Spiraling Up is now available as an audiobook at Amazon, Audible, Google Play, and Audiobooks.com, among others.
Cybersecurity Update
In our August 2022 newsletter, I told a true story of clients who were dealing with some surprisingly challenging cybersecurity fraud issues. I also included some recommendations to help others avoid getting their accounts hacked in the first place.
In October, I came across some other excellent suggestions on the Fidelity website that can help keep your accounts safe, and I shared them in our 3rd quarter reports. Because this topic is so important, I’m sharing a modified version of that information today:
- 2-Factor Authentication – This allows you to get a security code via a text message or an automated call for an extra layer of security when you log in. While I discussed 2-Factor Authentication in the August newsletter, I didn’t specifically say how to enable that for your Fidelity accounts. You can set this up on the Fidelity.com Security Center (login required) by clicking on “Accounts & Trade” at the top of the Fidelity home page, followed by “Security Settings.” Then click “Enable” in the 2-Factor Authentication section.
- Security Text Alerts – This allows Fidelity to send you an alert via text when potentially fraudulent transactions or updates are made to your account. You can set this up on the Fidelity.com Security Center (login required) by clicking on “Accounts & Trade” at the top of the Fidelity home page, followed by “Security Settings.” Then click “Enable” in the Security Text Alerts section. I set this up on my account, along with 2-factor authentication, in just a couple of minutes.
- Review your credit report – All US citizens can get one free credit report from Experian, Equifax, and Transunion annually. The report will show you if your credit rating has changed and whether anyone other than you has requested to open new credit, like a loan or credit card.
- Review your Fidelity accounts – We don’t encourage clients to look at their account balances too often. Reacting to month-to-month changes normally is not in one’s best interests. However, it’s a good idea to look at your accounts monthly to make sure there’s no questionable account activity like unexpected withdrawals or updated contact information. If you see anything that doesn’t look right, let us know immediately.
I hope the above recommendations help keep your accounts safe in 2023 and beyond.
With the challenging year of 2022 coming to a close and 2023 in our sights, I’m reflecting on how grateful I am to be a part of TABR Capital Management. I feel fortunate to work closely with Bob Kargenian, Sylvia Bazan, and Jamie Klein, and we all know that we owe everything to our wonderful clients. Thank you for your continued trust and support. All of us here at TABR wish you and your families a happy, healthy, and prosperous 2023!
Best regards,
![]()
Steven W. Medland, MBA, CFP®
Partner
TABR Capital Management, LLC (“TABR”) is an SEC registered investment advisor with its principal place of business in the state of California. TABR and its representatives are in compliance with the current notice filing and registration requirements imposed upon registered investment advisors by those states in which TABR maintains clients. TABR may only transact business in those states in which it is notice filed, or qualifies for an exemption or exclusion from notice filing requirements.
This newsletter is limited to the dissemination of general information pertaining to our investment advisory/management services. Any subsequent, direct communication by TABR with a prospective client shall be conducted by a representative that is either registered or qualifies for an exemption or exclusion from registration in the state where the prospective client resides. For information pertaining to the registration status of TABR, please contact TABR or refer to the Investment Advisor Disclosure web site (www.adviserinfo.sec.gov).
The TABR Model Portfolios are allocated in a range of investments according to TABR’s proprietary investment strategies. TABR’s proprietary investment strategies are allocated amongst individual stocks, bonds, mutual funds, ETFs and other instruments with a view towards income and/or capital appreciation depending on the specific allocation employed by each Model Portfolio. TABR tracks the performance of each Model Portfolio in an actual account that is charged TABR’s investment management fees in the exact manner as would an actual client account. Therefore the performance shown is net of TABR’s investment management fees, and also reflect the deduction of transaction and custodial charges, if any.
Comparison of the TABR Model Portfolios to the Vanguard Total Stock Index Fund, the Vanguard Total International Stock Fund, the Vanguard Total Bond Index Fund and the S&P 500 Index is for illustrative purposes only and the volatility of the indices used for comparison may be materially different from the volatility of the TABR Model Portfolios due to varying degrees of diversification and/or other factors.
Past performance of the TABR Model Portfolios may not be indicative of future results and the performance of a specific individual client account may vary substantially from the composite results above in part because client accounts may be allocated among several portfolios. Different types of investments involve varying degrees of risk, and there can be no assurance that any specific investment will be profitable
For additional information about TABR, including fees and services, send for our disclosure statement as set forth on Form ADV from us using the contact information herein. Please read the disclosure statement carefully before you invest or send money.
A list of all recommendations made by TABR within the immediately preceding one year is available upon request at no charge. The sample client experiences described herein are included for illustrative purposes and there can be no assurance that TABR will be able to achieve similar results in comparable situations. No portion of this writing is to be interpreted as a testimonial or endorsement of TABR’s investment advisory services and it is not known whether the clients referenced approve of TABR or its services.